UMB Financial Corporation (UMBF): Price and Financial Metrics
UMBF Price/Volume Stats
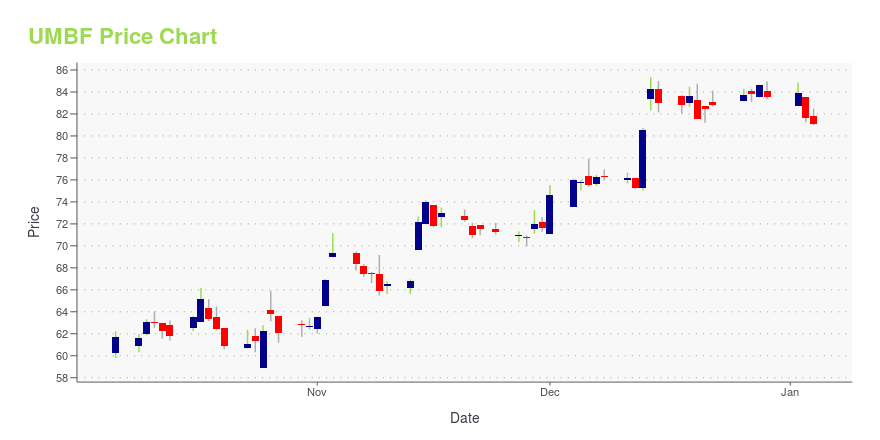
Current price | $86.99 | 52-week high | $87.36 |
Prev. close | $85.61 | 52-week low | $50.68 |
Day low | $83.60 | Volume | 318,710 |
Day high | $87.36 | Avg. volume | 224,610 |
50-day MA | $81.42 | Dividend yield | 1.91% |
200-day MA | $71.41 | Market Cap | 4.24B |
UMBF Stock Price Chart Interactive Chart >
UMBF POWR Grades
- UMBF scores best on the Stability dimension, with a Stability rank ahead of 54.16% of US stocks.
- The strongest trend for UMBF is in Growth, which has been heading up over the past 26 weeks.
- UMBF ranks lowest in Quality; there it ranks in the 17th percentile.
UMBF Stock Summary
- Equity multiplier, or assets relative to shareholders' equity, comes in at 14.55 for UMB FINANCIAL CORP; that's greater than it is for 95.98% of US stocks.
- With a year-over-year growth in debt of 64.72%, UMB FINANCIAL CORP's debt growth rate surpasses 88.73% of about US stocks.
- Shareholder yield, a measure of how much is returned to shareholders via dividends and share repurchases, for UMBF comes in at -42.01% -- higher than that of just 9.33% of stocks in our set.
- Stocks that are quantitatively similar to UMBF, based on their financial statements, market capitalization, and price volatility, are FBP, CFR, CUBI, PBHC, and FISI.
- Visit UMBF's SEC page to see the company's official filings. To visit the company's web site, go to www.umb.com.
UMBF Valuation Summary
- In comparison to the median Financial Services stock, UMBF's price/sales ratio is 133.33% higher, now standing at 2.8.
- UMBF's EV/EBIT ratio has moved down 9.8 over the prior 243 months.
Below are key valuation metrics over time for UMBF.
Stock | Date | P/S | P/B | P/E | EV/EBIT |
---|---|---|---|---|---|
UMBF | 2023-12-22 | 2.8 | 1.4 | 10.6 | 9.0 |
UMBF | 2023-12-21 | 2.8 | 1.4 | 10.5 | 9.0 |
UMBF | 2023-12-20 | 2.8 | 1.4 | 10.4 | 8.9 |
UMBF | 2023-12-19 | 2.9 | 1.4 | 10.7 | 9.1 |
UMBF | 2023-12-18 | 2.8 | 1.4 | 10.6 | 9.0 |
UMBF | 2023-12-15 | 2.9 | 1.4 | 10.6 | 9.1 |
UMBF Growth Metrics
- Its 2 year price growth rate is now at 84.03%.
- The 2 year revenue growth rate now stands at 30.54%.
- Its 5 year revenue growth rate is now at 3.61%.
The table below shows UMBF's growth in key financial areas (numbers in millions of US dollars).
Date | Revenue | Operating Cash Flow | Net Income to Common Stock |
---|---|---|---|
2022-09-30 | 1,389.319 | 796.829 | 410.005 |
2022-06-30 | 1,371.783 | 762.634 | 416.482 |
2022-03-31 | 1,292.717 | 614.194 | 366.338 |
2021-12-31 | 1,262.696 | 534.082 | 353.018 |
2021-09-30 | 1,359.809 | 520.327 | 430.842 |
2021-06-30 | 1,318.517 | 449.17 | 409.467 |
UMBF's Quality Factors
The “Quality” component of the POWR Ratings focuses on 31 different factors of a companies fundamentals and operational strength. Here are some key insights as we drill into the specifics of these quality attributes.- UMBF has a Quality Grade of C, ranking ahead of 31% of graded US stocks.
- UMBF's asset turnover comes in at 0.038 -- ranking 213th of 428 Banking stocks.
- HFBL, SFBS, and CVLY are the stocks whose asset turnover ratios are most correlated with UMBF.
The table below shows UMBF's key quality metrics over time.
Period | Asset Turnover | Gross Margin | ROIC |
---|---|---|---|
2021-09-30 | 0.038 | 1 | 0.016 |
2021-06-30 | 0.039 | 1 | 0.016 |
2021-03-31 | 0.040 | 1 | 0.015 |
2020-12-31 | 0.039 | 1 | 0.012 |
2020-09-30 | 0.036 | 1 | 0.008 |
2020-06-30 | 0.038 | 1 | 0.008 |
UMBF Price Target
For more insight on analysts targets of UMBF, see our UMBF price target page. And for a list of of all stocks sorted by upside potential based on analyst target price, see our Top Price Target page.
Average Price Target | $104.20 | Average Broker Recommendation | 1.8 (Moderate Buy) |
UMB Financial Corporation (UMBF) Company Bio
UMB Financial provides various banking and other financial products and services in Missouri, Kansas, Colorado, Illinois, Oklahoma, Arizona, Nebraska, Pennsylvania, South Dakota, Indiana, Wisconsin, Utah, Texas, and Massachusetts states. The company was founded in 1967 and is based in Kansas City, Missouri.
Latest UMBF News From Around the Web
Below are the latest news stories about UMB FINANCIAL CORP that investors may wish to consider to help them evaluate UMBF as an investment opportunity.
Loan Growth Aids UMB Financial (UMBF) Amid Rising CostsUMB Financial's (UMBF) rising loan balances are likely to support its balance sheet position. Yet, rising operating expenses keep the bottom line under pressure. |
Strength Seen in First Busey (BUSE): Can Its 5.2% Jump Turn into More Strength?First Busey (BUSE) saw its shares surge in the last session with trading volume being higher than average. The latest trend in earnings estimate revisions could translate into further price increase in the near term. |
UMB Financial Corp's Dividend AnalysisUMB Financial Corp (NASDAQ:UMBF) recently announced a dividend of $0.39 per share, payable on 2024-01-02, with the ex-dividend date set for 2023-12-08. As investors look forward to this upcoming payment, the spotlight also shines on the company's dividend history, yield, and growth rates. Using the data from GuruFocus, let's look into UMB Financial Corps dividend performance and assess its sustainability. |
UMB Fund Services Assists StepStone Private Wealth with Flagship Fund Transition to Daily Admittance, Launch of New Infrastructure FundMILWAUKEE, November 30, 2023--UMB Fund Services, Inc. (UMBFS), a subsidiary of UMB Financial Corporation (NASDAQ: UMBF), announced today its service expansion for StepStone Group Private Wealth LLC, part of StepStone Group Inc. (NASDAQ: STEP), one of the largest asset managers focused exclusively on private markets. |
Why Is UMB (UMBF) Up 14.9% Since Last Earnings Report?UMB (UMBF) reported earnings 30 days ago. What's next for the stock? We take a look at earnings estimates for some clues. |
UMBF Price Returns
1-mo | 8.33% |
3-mo | 4.60% |
6-mo | 41.57% |
1-year | 48.99% |
3-year | -0.09% |
5-year | 48.99% |
YTD | 4.60% |
2023 | 2.21% |
2022 | -19.97% |
2021 | 56.04% |
2020 | 2.64% |
2019 | 14.71% |
UMBF Dividends
Ex-Dividend Date | Type | Payout Amount | Change | ||||||
---|---|---|---|---|---|---|---|---|---|
Loading, please wait... |
Continue Researching UMBF
Want to see what other sources are saying about Umb Financial Corp's financials and stock price? Try the links below:Umb Financial Corp (UMBF) Stock Price | Nasdaq
Umb Financial Corp (UMBF) Stock Quote, History and News - Yahoo Finance
Umb Financial Corp (UMBF) Stock Price and Basic Information | MarketWatch
Loading social stream, please wait...