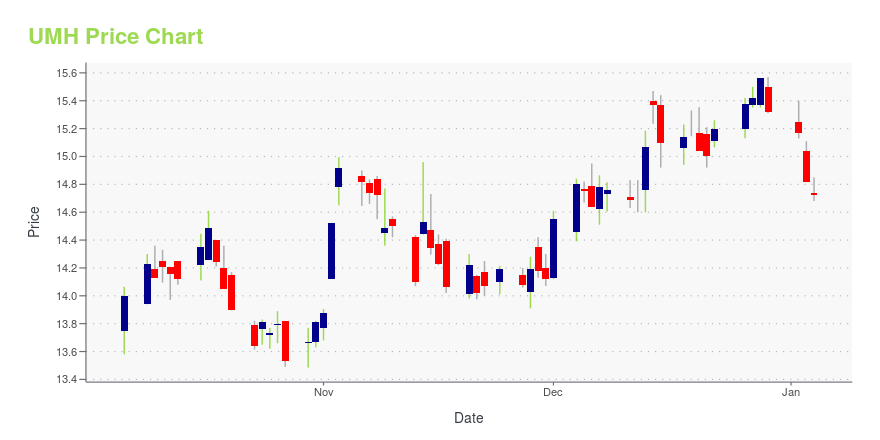
UMH Properties, Inc. (UMH): Price and Financial Metrics
UMH Price/Volume Stats
| Current price | $17.68 | 52-week high | $17.97 |
| Prev. close | $17.40 | 52-week low | $13.26 |
| Day low | $17.42 | Volume | 243,983 |
| Day high | $17.71 | Avg. volume | 381,331 |
| 50-day MA | $15.99 | Dividend yield | 4.86% |
| 200-day MA | $15.31 | Market Cap | 1.24B |
UMH Stock Price Chart Interactive Chart >
UMH Properties, Inc. (UMH) Company Bio
UMH Properties engages owns and operates manufactured home communities in New York, New Jersey, Pennsylvania, Ohio, and Tennessee. The company was founded in 1968 and is based in Freehold, New Jersey.
Latest UMH News From Around the Web
Below are the latest news stories about UMH PROPERTIES INC that investors may wish to consider to help them evaluate UMH as an investment opportunity.
3 Residential REITs With Yields Up To 7.22%Residential real estate investment trusts (REITs) own, operate and/or finance income-producing residential properties. They provide a way for people to invest in large-scale real estate operations without having to buy or manage properties themselves. Residential REITs invest in various types of housing, such as apartments, student housing and single-family homes, and generate revenue through leasing space and collecting rents on the properties they own. There's no shortage of reasons to invest |
UMH PROPERTIES, INC. ANNOUNCES ADDITION TO FANNIE MAE CREDIT FACILITYFREEHOLD, NJ, Dec. 14, 2023 (GLOBE NEWSWIRE) -- UMH Properties, Inc. (NYSE: UMH) (TASE: UMH) today announced that it completed the addition of eight communities, containing 1,281 sites, to its Fannie Mae credit facility through Wells Fargo Bank, N.A., for total proceeds of approximately $57.7 million. It is a fixed rate, interest only loan at 5.97% with a 10-year term. The proceeds will be used to invest in additional acquisitions, expansions, rental homes and repay higher interest rate debt on |
Wall Street Analysts See a 28.81% Upside in UMH (UMH): Can the Stock Really Move This High?The consensus price target hints at a 28.8% upside potential for UMH (UMH). While empirical research shows that this sought-after metric is hardly effective, an upward trend in earnings estimate revisions could mean that the stock will witness an upside in the near term. |
UMH Properties (UMH), Nuveen Real Estate Grow Ties, Stock UpUMH Properties' (UMH) strategic expansion with Nuveen Real Estate positions the company for sustained growth in the manufactured housing sector. |
UMH PROPERTIES, INC. EXPANDS JOINT VENTURE PARTNERSHIP WITH NUVEEN REAL ESTATEFREEHOLD, NJ, Nov. 30, 2023 (GLOBE NEWSWIRE) -- UMH Properties, Inc. (NYSE: UMH) (TASE: UMH) today announced that it has expanded its partnership with Nuveen Real Estate, a TIAA company through entering into a new joint venture. The joint venture focuses on the development of a new manufactured housing community located in Honey Brook, Pennsylvania, which is part of the Philadelphia MSA. UMH will have a 40% stake in the joint venture and will serve as the managing member, developer and operating |
UMH Price Returns
| 1-mo | 15.10% |
| 3-mo | 14.47% |
| 6-mo | 18.01% |
| 1-year | 19.07% |
| 3-year | -12.93% |
| 5-year | 72.61% |
| YTD | 18.70% |
| 2023 | 0.21% |
| 2022 | -38.67% |
| 2021 | 91.34% |
| 2020 | -0.73% |
| 2019 | 40.13% |
UMH Dividends
| Ex-Dividend Date | Type | Payout Amount | Change | ||||||
|---|---|---|---|---|---|---|---|---|---|
| Loading, please wait... | |||||||||
Continue Researching UMH
Here are a few links from around the web to help you further your research on Umh Properties Inc's stock as an investment opportunity:Umh Properties Inc (UMH) Stock Price | Nasdaq
Umh Properties Inc (UMH) Stock Quote, History and News - Yahoo Finance
Umh Properties Inc (UMH) Stock Price and Basic Information | MarketWatch


Loading social stream, please wait...