
Unum Group (UNM): Price and Financial Metrics
UNM Price/Volume Stats
| Current price | $53.24 | 52-week high | $54.66 |
| Prev. close | $53.38 | 52-week low | $41.75 |
| Day low | $53.05 | Volume | 1,059,915 |
| Day high | $53.64 | Avg. volume | 1,258,659 |
| 50-day MA | $51.83 | Dividend yield | 2.71% |
| 200-day MA | $49.02 | Market Cap | 10.08B |
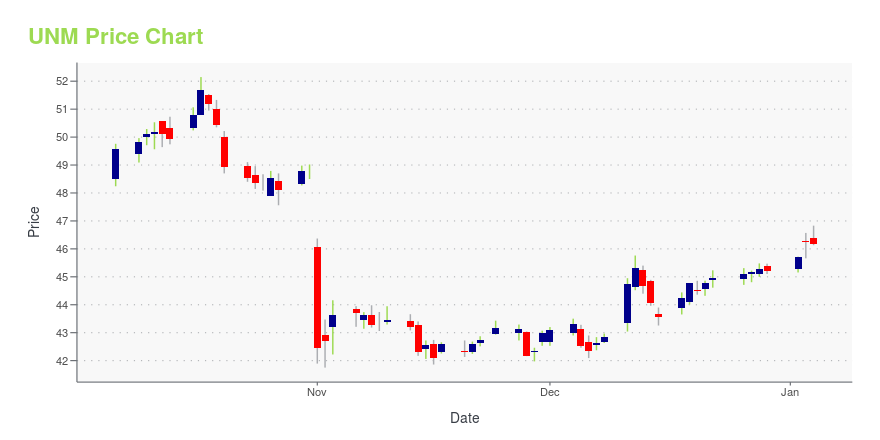
UNM Stock Price Chart Interactive Chart >
Unum Group (UNM) Company Bio
Unum Group is an American insurance company company headquartered in Chattanooga, Tennessee. Founded as Union Mutual in 1848 and known as UnumProvident from 1999-2007, the company is part of the Fortune 500. Unum Group was created by the 1999 merger of Unum Corporation and The Provident Companies and comprises four distinct businesses – Unum US, Unum UK, Unum Poland and Colonial Life. Its underwriting insurers include The Paul Revere Life Insurance Company and Provident Life and Accident Insurance Company. Unum is the top disability insurer in both the United States and United Kingdom and also offers other insurance products including accident, critical illness and life insurance. (Source:Wikipedia)
Latest UNM News From Around the Web
Below are the latest news stories about UNUM GROUP that investors may wish to consider to help them evaluate UNM as an investment opportunity.
Unum (UNM) Outpaces Stock Market Gains: What You Should KnowIn the latest trading session, Unum (UNM) closed at $44.76, marking a +1.18% move from the previous day. |
How to Earn $500 From Unum StockUnum Group (NYSE:UNM) shares are currently selling for $42, and it is in a position to gain from long-term growth estimates. Over the past year, UNM stock has gained 4.4%, and it has the potential to earn more through the Unum Group’s unique and improved product line. UNM has consistently increased its dividends and share buybacks, boosting its shareholders' value and prospects. Don't Miss: Jeff Bezos called the meteoric success of this real estate investing strategy early on. He bet millions on |
15 Best Life Insurance Companies Heading into 2024In this article, we will look into the 15 best life insurance companies heading into 2024. If you want to skip our detailed analysis, you can go directly to the 5 Best Life Insurance Companies Heading into 2024. Life Insurance Industry: A Market Analysis Life insurance provides insurance to individuals against the financial repercussions of […] |
Unum (UNM) Exceeds Market Returns: Some Facts to ConsiderUnum (UNM) closed the most recent trading day at $45.32, moving +1.27% from the previous trading session. |
Unum (UNM) Sees a More Significant Dip Than Broader Market: Some Facts to KnowUnum (UNM) closed the most recent trading day at $42.34, moving -0.42% from the previous trading session. |
UNM Price Returns
| 1-mo | 6.41% |
| 3-mo | 5.74% |
| 6-mo | 13.99% |
| 1-year | 12.67% |
| 3-year | 114.78% |
| 5-year | 98.97% |
| YTD | 20.44% |
| 2023 | 13.72% |
| 2022 | 73.56% |
| 2021 | 11.87% |
| 2020 | -16.22% |
| 2019 | 2.63% |
UNM Dividends
| Ex-Dividend Date | Type | Payout Amount | Change | ||||||
|---|---|---|---|---|---|---|---|---|---|
| Loading, please wait... | |||||||||
Continue Researching UNM
Here are a few links from around the web to help you further your research on Unum Group's stock as an investment opportunity:Unum Group (UNM) Stock Price | Nasdaq
Unum Group (UNM) Stock Quote, History and News - Yahoo Finance
Unum Group (UNM) Stock Price and Basic Information | MarketWatch
Loading social stream, please wait...