
United Parcel Service Inc. Cl B (UPS): Price and Financial Metrics
UPS Price/Volume Stats
| Current price | $128.83 | 52-week high | $189.65 |
| Prev. close | $127.08 | 52-week low | $124.80 |
| Day low | $128.46 | Volume | 7,271,324 |
| Day high | $129.86 | Avg. volume | 4,232,442 |
| 50-day MA | $138.40 | Dividend yield | 5.11% |
| 200-day MA | $147.54 | Market Cap | 110.22B |
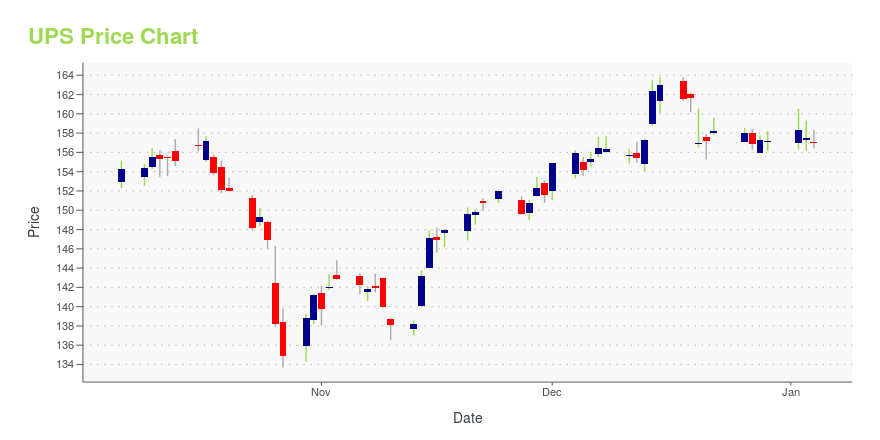
UPS Stock Price Chart Interactive Chart >
United Parcel Service Inc. Cl B (UPS) Company Bio
United Parcel Service Inc was founded in 1907 in Seattle, Washington. The company is a package delivery organization and provider of supply chain management solutions. Its services include transportation, distribution, contract logistics, ground freight, ocean freight, air freight, insurance, and financing. The company operates on six continents and more than 220 countries and territories around the world. In 2020, UPS delivered 6.5 billion packages around the world and had a net revenue of 84.6 billion. The company is headquartered in Atlanta, Georgia and employs over 495,000 individuals across the globe. Carol B Tome currently serves as the company’s 12th Chief Executive Officer.
Latest UPS News From Around the Web
Below are the latest news stories about UNITED PARCEL SERVICE INC that investors may wish to consider to help them evaluate UPS as an investment opportunity.
United Parcel Service Layoffs 2024: What to Know About the Latest UPS Job CutsWith United Parcel Service feeling the heat from reduced parcel volume, the company announced layoffs, raising concerns over UPS stock. |
My Top High-Yield Dividend Stock to Buy for 2024UPS blends growth, value, and a high dividend yield. |
FedEx's Profit Miss and Lowered Outlook Warn This Holiday Season Has Been More Ho-Hum Than Ho-HoLast Tuesday, FedEx Corporation (NYSE: FDX) shares tumbled almost 10% as the delivery company reported fiscal second quarter results below expectations and lowered its full year guidance. FedEx’s disappointing figures also dragged down the shares of its rival, United Parcel Service Inc (NYSE: UPS) by 2.9% on the day of the report. On December 21st, UPS lost its court battle against EU antitrust regulators who blocked its 2013 bid for Dutch rival TNT for a record $1.90 billion compensation claim. |
3 Meme Stocks Poised for a Viral Comeback in 2024Forget the stiff suits on Wall Street; the real market movers in 2024 might be armed with rocket emojis and diamond hands, which is why we need to discuss comeback meme stocks to buy. |
Labor 2023: A lot of noise but few strikesLabor peace was won at what will be higher costs for shippers and carriers. The post Labor 2023: A lot of noise but few strikes appeared first on FreightWaves. |
UPS Price Returns
| 1-mo | -6.75% |
| 3-mo | -11.74% |
| 6-mo | -17.31% |
| 1-year | -27.90% |
| 3-year | -26.11% |
| 5-year | 27.01% |
| YTD | -16.22% |
| 2023 | -5.96% |
| 2022 | -15.47% |
| 2021 | 30.02% |
| 2020 | 48.64% |
| 2019 | 24.24% |
UPS Dividends
| Ex-Dividend Date | Type | Payout Amount | Change | ||||||
|---|---|---|---|---|---|---|---|---|---|
| Loading, please wait... | |||||||||
Continue Researching UPS
Want to see what other sources are saying about United Parcel Service Inc's financials and stock price? Try the links below:United Parcel Service Inc (UPS) Stock Price | Nasdaq
United Parcel Service Inc (UPS) Stock Quote, History and News - Yahoo Finance
United Parcel Service Inc (UPS) Stock Price and Basic Information | MarketWatch
Loading social stream, please wait...