Upstart Holdings, Inc. (UPST): Price and Financial Metrics
GET POWR RATINGS... FREE!
UPST POWR Grades
- Growth is the dimension where UPST ranks best; there it ranks ahead of 88.64% of US stocks.
- UPST's strongest trending metric is Momentum; it's been moving down over the last 179 days.
- UPST's current lowest rank is in the Stability metric (where it is better than 3% of US stocks).
UPST Stock Summary
- UPST's went public 1.28 years ago, making it older than merely 1.42% of listed US stocks we're tracking.
- With a year-over-year growth in debt of 869.8%, Upstart Holdings Inc's debt growth rate surpasses 98.28% of about US stocks.
- Over the past twelve months, UPST has reported earnings growth of 2,004.67%, putting it ahead of 98.8% of US stocks in our set.
- Stocks that are quantitatively similar to UPST, based on their financial statements, market capitalization, and price volatility, are ETSY, OMCL, PUBM, HEAR, and ECOM.
- Visit UPST's SEC page to see the company's official filings. To visit the company's web site, go to www.upstart.com.
UPST Valuation Summary
- UPST's EV/EBIT ratio is 2301; this is 26655.81% higher than that of the median Financial Services stock.
- Over the past 35 weeks, UPST's EV/EBIT ratio has gone up 7760.7.
- Over the past 35 weeks, UPST's price/earnings ratio has gone up 7125.3.
Below are key valuation metrics over time for UPST.
Stock | Date | P/S | P/B | P/E | EV/EBIT |
---|---|---|---|---|---|
UPST | 2021-07-09 | 39.5 | 28.8 | 1542.5 | 1409.0 |
UPST | 2021-06-04 | 54.0 | 39.4 | 2108.5 | 1942.1 |
UPST | 2021-05-17 | 37.9 | 27.6 | 1478.2 | 1348.5 |
UPST | 2021-03-04 | 24.2 | -84.1 | -8539.9 | -10164.3 |
UPST | 2021-02-18 | 36.3 | -126.0 | -12800.4 | -15229.1 |
UPST | 2020-12-22 | 21.1 | -73.2 | -7438.8 | -8855.4 |
UPST Price Target
For more insight on analysts targets of UPST, see our UPST price target page. And for a list of of all stocks sorted by upside potential based on analyst target price, see our Top Price Target page.
Average Price Target | $139.29 | Average Broker Recommendation | 1.44 (Moderate Buy) |
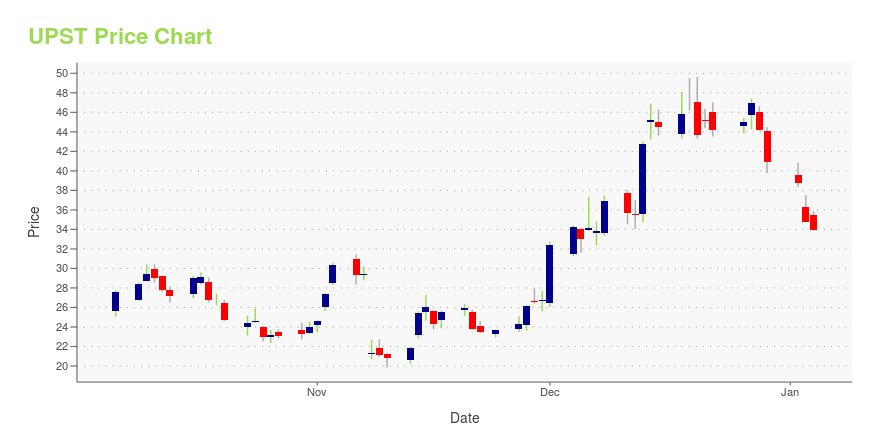
UPST Stock Price Chart Interactive Chart >
UPST Price/Volume Stats
Current price | $50.06 | 52-week high | $401.49 |
Prev. close | $43.10 | 52-week low | $25.43 |
Day low | $43.37 | Volume | 7,927,271 |
Day high | $51.41 | Avg. volume | 11,660,664 |
50-day MA | $79.76 | Dividend yield | N/A |
200-day MA | $173.98 | Market Cap | 4.24B |
Upstart Holdings, Inc. (UPST) Company Bio
Upstart Holdings, Inc. operates a cloud- based artificial intelligence (AI) lending platform. The company's platform aggregates consumer demand for loans and connects it to its network of the company's AI- enabled bank partners. Its platform connects consumers, banks, and institutional investors through a shared AI lending platform. Upstart Holdings, Inc. was incorporated in 2012 and is headquartered in San Mateo, California.
Latest UPST News From Around the Web
Below are the latest news stories about Upstart Holdings Inc that investors may wish to consider to help them evaluate UPST as an investment opportunity.
Upstart Is Poised to Advance With Solid Earnings and GuidanceUpstart's fundamentals and outlook are very strong, leaving UPST stock well-positioned to climb much further. |
Thinking about trading options or stock in Block, Carter''s, Upstart Holdings, Sea Ltd, or Shopify?NEW YORK , Feb. 25, 2022 /PRNewswire/ -- InvestorsObserver issues critical PriceWatch Alerts for SQ, CRI, UPST, SE, and SHOP. … Full story available on Benzinga.com |
Why Spectacular Q4 Earnings Are Just the Beginning for Airbnb and UpstartUpstart, an AI-powered loan facilitator, is continuing to grow and disrupt the FICO score. Upstart has also partnered with 42 banks, up from 10 in Q3 of 2020. Additionally, Upstart's management indicated that the business could perform well as stimulus payments end and default rates on their loans increase. |
7 Red-Hot Growth Stocks That Could Be Headed to the MoonGrowth stocks are trading through a brutal bear market. |
How Is The Market Feeling About Upstart Holdings Inc. - Common Stock?Upstart Holdings Inc. - Common stock''s (NASDAQ: UPST ) short percent of float has risen 22.8% since its last report. The company recently reported that it has 6.88 million shares sold short , which is 11.15% of all regular shares that are available for trading. Based on its trading volume, it would take traders 1.3 days to cover their short positions on average. Why Short Interest Matters Short interest is the number of shares that have been sold short but have not yet been covered or closed out. Short selling is when a trader sells shares of a company they do not own, with the hope that the price will fall. Traders make money from short selling if the price of the … Full story available on Benzinga.com |
UPST Price Returns
1-mo | -30.32% |
3-mo | -63.16% |
6-mo | -76.09% |
1-year | -69.99% |
3-year | N/A |
5-year | N/A |
YTD | -66.91% |
2021 | 271.29% |
2020 | N/A |
2019 | N/A |
2018 | N/A |
2017 | N/A |
Loading social stream, please wait...