Usio, Inc. (USIO): Price and Financial Metrics

Usio, Inc. (USIO): $1.97

0.22 (+12.57%)

POWR Rating

Component Grades

Momentum

C

Stability

C

Sentiment

Quality

C

USIO Price/Volume Stats
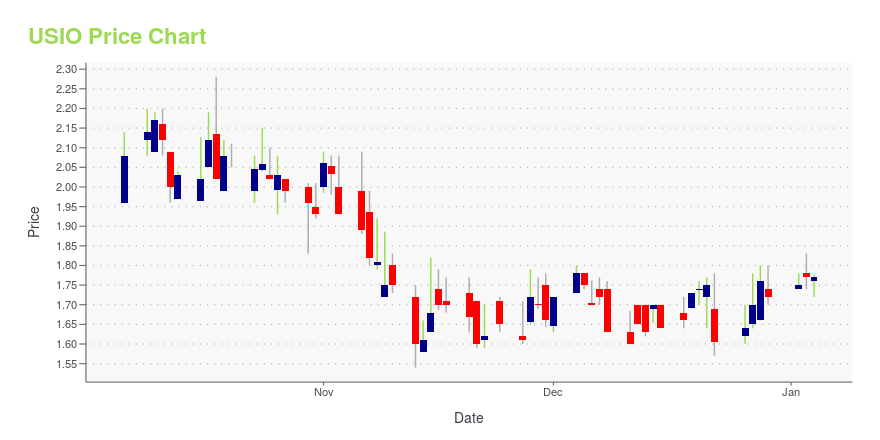
Current price $1.97 52-week high $2.56
Prev. close $1.75 52-week low $1.28
Day low $1.76 Volume 201,300
Day high $1.99 Avg. volume 34,628
50-day MA $1.68 Dividend yield N/A
200-day MA $1.82 Market Cap 51.98M

USIO Stock Price Chart Interactive Chart >

USIO Stock Summary

  • With a market capitalization of $43,271,943, USIO INC has a greater market value than merely 14.78% of US stocks.
  • USIO INC's capital turnover -- a measure of revenue relative to shareholder's equity -- is better than 91.17% of US listed stocks.
  • Price to trailing twelve month operating cash flow for USIO is currently 1.32, higher than only 3.86% of US stocks with positive operating cash flow.
  • If you're looking for stocks that are quantitatively similar to USIO INC, a group of peers worth examining would be XPOF, ASRT, NMRK, AMG, and GHL.
  • Visit USIO's SEC page to see the company's official filings. To visit the company's web site, go to www.usio.com.

USIO Valuation Summary

  • USIO's EV/EBIT ratio is -27; this is 237.06% lower than that of the median Technology stock.
  • Over the past 243 months, USIO's price/sales ratio has gone down 1.2.

Below are key valuation metrics over time for USIO.

Stock Date P/S P/B P/E EV/EBIT
USIO 2023-09-22 0.6 2.9 -25.5 -27.0
USIO 2023-09-21 0.6 2.9 -25.5 -27.0
USIO 2023-09-20 0.6 2.9 -26.0 -27.8
USIO 2023-09-19 0.6 3.0 -26.5 -28.3
USIO 2023-09-18 0.6 3.1 -27.7 -29.8
USIO 2023-09-15 0.6 3.1 -27.6 -29.7

USIO Growth Metrics

    Its year over year net income to common stockholders growth rate is now at 56.16%.
  • Its 3 year cash and equivalents growth rate is now at 101.14%.
  • The 4 year net cashflow from operations growth rate now stands at -781.64%.
Over the past 33 months, USIO's revenue has gone up $39,948,809.

The table below shows USIO's growth in key financial areas (numbers in millions of US dollars).

Date Revenue Operating Cash Flow Net Income to Common Stock
2022-09-30 68.14934 -1.713764 -5.293484
2022-06-30 67.57465 5.119931 -3.38248
2022-03-31 66.59211 12.08072 -1.223652
2021-12-31 61.94232 29.78492 -0.321634
2021-09-30 53.89827 10.39728 -0.207523
2021-06-30 46.21428 -7.57905 -1.284774

USIO's Quality Factors

The “Quality” component of the POWR Ratings focuses on 31 different factors of a companies fundamentals and operational strength. Here are some key insights as we drill into the specifics of these quality attributes.
  • USIO has a Quality Grade of F, ranking ahead of 4.02% of graded US stocks.
  • USIO's asset turnover comes in at 0.602 -- ranking 9th of 428 Banking stocks.
  • SFBS, CURO, and PBIP are the stocks whose asset turnover ratios are most correlated with USIO.

The table below shows USIO's key quality metrics over time.

Period Asset Turnover Gross Margin ROIC
2021-06-30 0.602 0.242 -0.110
2021-03-31 0.512 0.220 -0.297
2020-12-31 0.497 0.229 -0.342
2020-09-30 0.507 0.213 -0.575
2020-06-30 0.486 0.215 -0.610
2020-03-31 0.499 0.223 -0.594

USIO Price Target

For more insight on analysts targets of USIO, see our USIO price target page. And for a list of of all stocks sorted by upside potential based on analyst target price, see our Top Price Target page.

Average Price Target $9.88 Average Broker Recommendation 1.25 (Strong Buy)

Usio, Inc. (USIO) Company Bio


Usio, Inc. offers integrated payment solutions. The Company operates credit and debit, prepaid, automated clearing house (ACH) payment processing, and payment facilitation platforms. Usio provides a range of payment solutions to software companies, merchants, banks, service bureaus, and card issuers.


USIO Latest News Stream


Event/Time News Detail
Loading, please wait...

USIO Latest Social Stream


Loading social stream, please wait...

View Full USIO Social Stream

Latest USIO News From Around the Web

Below are the latest news stories about USIO INC that investors may wish to consider to help them evaluate USIO as an investment opportunity.

Usio to Present at The LD Micro Main Event XVI

SAN ANTONIO, September 20, 2023--Usio to Present at LD Micro Conference

Yahoo | September 20, 2023

Usio Chosen by Fitli, Inc – Leading Fitness ISV – as Payments Processor of Choice

SAN ANTONIO, September 13, 2023--Usio, Inc. (Nasdaq: USIO), a leading FinTech company that operates a full stack of integrated, cloud-based electronic payment and embedded financial solutions, today announced that it has been chosen by Fitli, Inc, a leading software provider for fitness professionals, as its Payments Provider of choice. Fitli will integrate Usio’s unique PayFac-in-a-Box™ payments technology into their platform trusted by hundreds of personal trainers, gyms, dance, pilates, and y

Yahoo | September 13, 2023

Usio to Participate in the H.C. Wainwright 25th Annual Global Investment Conference

SAN ANTONIO, September 06, 2023--Usio, Inc. (NASDAQ: USIO), a leading FinTech integrated electronic payment solutions provider, announced today that it will be participating in person at the H.C. Wainwright 25th Annual Global Investment Conference being held September 11 – 13th.

Yahoo | September 6, 2023

Usio Announces Record Second Quarter 2023 Financial Results

SAN ANTONIO, August 14, 2023--Usio, Inc: (Nasdaq: USIO), a leading FinTech company that operates a full stack of integrated, cloud-based electronic payment and embedded financial solutions, today announced financial results for the second quarter, which ended June 30, 2023.

Yahoo | August 14, 2023

Usio Announces New Date for Second Quarter Fiscal 2023 Conference Call

SAN ANTONIO, August 10, 2023--Usio, Inc. (Nasdaq:USIO), a leading FinTech that operates a full stack of integrated, cloud-based electronic payment and embedded financial solutions, today announced it will now release second quarter fiscal 2023 financial results for the period ended June 30, 2023, after the market closes on Monday, August 14, 2023.

Yahoo | August 10, 2023

Read More 'USIO' Stories Here

USIO Price Returns

1-mo 16.57%
3-mo N/A
6-mo 7.65%
1-year 51.54%
3-year 26.28%
5-year 11.93%
YTD 19.39%
2022 -62.16%
2021 63.30%
2020 71.15%
2019 -6.02%
2018 -34.39%

Get Free Updates

Join thousands of investors who get the latest news, insights and top rated picks from StockNews.com!