
Utz Brands, Inc. (UTZ): Price and Financial Metrics
UTZ Price/Volume Stats
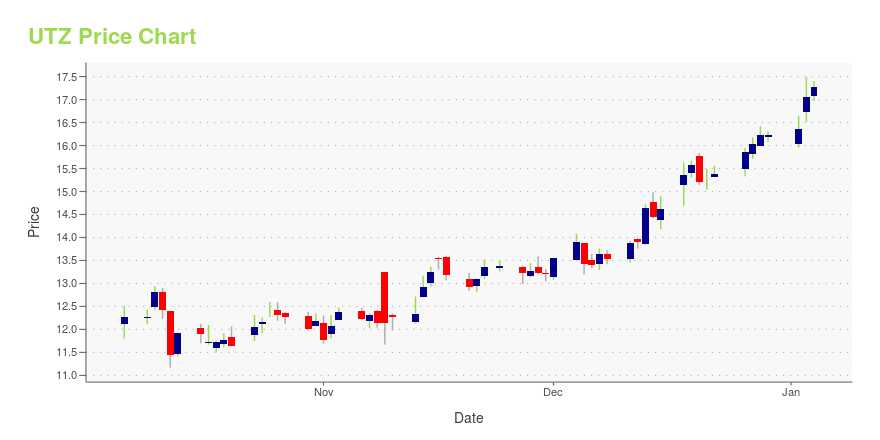
| Current price | $14.46 | 52-week high | $20.04 |
| Prev. close | $14.69 | 52-week low | $11.17 |
| Day low | $14.45 | Volume | 951,174 |
| Day high | $14.90 | Avg. volume | 773,336 |
| 50-day MA | $17.00 | Dividend yield | 1.62% |
| 200-day MA | $16.35 | Market Cap | 2.04B |
UTZ Stock Price Chart Interactive Chart >
Utz Brands, Inc. (UTZ) Company Bio
Utz Brands, Inc. provides packaged food products. The Company produces a full line of potato chips, pretzels, cheese snacks, veggie snacks, pork skins, pub and party mixes, tortilla chips, and other snacks. Utz Brands serves customers in the United States.
Latest UTZ News From Around the Web
Below are the latest news stories about UTZ BRANDS INC that investors may wish to consider to help them evaluate UTZ as an investment opportunity.
This Snack-Food Stock Is Small but Loaded With Upside. Why It’s a Buy.The company’s shortcomings mostly come from its size. But as it grows, operations could improve in a hurry and drive the shares. |
Your Dietitian Wouldn't Munch on Utz Brands as a Long, and Neither Would IUtz Brands was rated a new buy at Mizuho Securities here on Wednesday with a $19 price target. Let's check out the sodium content, charts and indicators of the snack foods maker to see if we should bite on the long side. In this daily bar chart of UTZ, below, I can see that prices have rallied from an early October low. |
Mighty Minis: 7 Small-Cap Stocks That Punch Above Their WeightWhile your typical financial advisor will likely direct you to focus on established blue chips to boost your holdings, few other compelling options exist other than powerful small-cap stocks. |
Utz Brands to Introduce Long-Term Growth Strategy at 2023 Investor DayHANOVER, Pa., December 15, 2023--Utz Brands, Inc. (NYSE: UTZ) ("Utz" or the "Company"), a leading U.S. manufacturer of branded salty snacks, will host its 2023 Investor Day today at the New York Stock Exchange, beginning at 9:30 am ET. |
Utz Brands Inc's Dividend AnalysisUtz Brands Inc (NYSE:UTZ) recently announced a dividend of $0.06 per share, payable on 2024-01-04, with the ex-dividend date set for 2023-12-15. As investors look forward to this upcoming payment, the spotlight also shines on the company's dividend history, yield, and growth rates. Using the data from GuruFocus, let's look into Utz Brands Inc's dividend performance and assess its sustainability. |
UTZ Price Returns
| 1-mo | -12.89% |
| 3-mo | -21.95% |
| 6-mo | -16.28% |
| 1-year | -10.81% |
| 3-year | -33.61% |
| 5-year | 50.33% |
| YTD | -10.25% |
| 2023 | 3.90% |
| 2022 | 0.91% |
| 2021 | -26.97% |
| 2020 | 115.77% |
| 2019 | N/A |
UTZ Dividends
| Ex-Dividend Date | Type | Payout Amount | Change | ||||||
|---|---|---|---|---|---|---|---|---|---|
| Loading, please wait... | |||||||||
Loading social stream, please wait...