Universal Security Instruments, Inc. (UUU): Price and Financial Metrics
GET POWR RATINGS... FREE!
UUU Stock Summary
- UUU has a higher market value than only 1.83% of US stocks; more precisely, its current market capitalization is $5,134,609.
- With a price/sales ratio of 0.25, UNIVERSAL SECURITY INSTRUMENTS INC has a higher such ratio than just 8.5% of stocks in our set.
- In terms of twelve month growth in earnings before interest and taxes, UNIVERSAL SECURITY INSTRUMENTS INC is reporting a growth rate of -307.39%; that's higher than merely 5.09% of US stocks.
- Stocks with similar financial metrics, market capitalization, and price volatility to UNIVERSAL SECURITY INSTRUMENTS INC are AMBO, NTWK, CYAN, IOSP, and EML.
- Visit UUU's SEC page to see the company's official filings. To visit the company's web site, go to www.universalsecurity.com.
UUU Valuation Summary
- UUU's EV/EBIT ratio is 15.5; this is 0.64% lower than that of the median Industrials stock.
- UUU's EV/EBIT ratio has moved up 8 over the prior 231 months.
Below are key valuation metrics over time for UUU.
Stock | Date | P/S | P/B | P/E | EV/EBIT |
---|---|---|---|---|---|
UUU | 2023-03-17 | 0.2 | 1.0 | 25.5 | 15.5 |
UUU | 2023-03-16 | 0.3 | 1.0 | 26.5 | 15.9 |
UUU | 2023-03-15 | 0.3 | 1.0 | 26.5 | 15.9 |
UUU | 2023-03-14 | 0.3 | 1.1 | 27.5 | 16.2 |
UUU | 2023-03-13 | 0.3 | 1.1 | 27.0 | 16.0 |
UUU | 2023-03-10 | 0.3 | 1.1 | 28.0 | 16.4 |
UUU Growth Metrics
- The 2 year price growth rate now stands at 75.14%.
- Its 2 year cash and equivalents growth rate is now at 367.76%.
- Its year over year net cashflow from operations growth rate is now at -233.99%.

The table below shows UUU's growth in key financial areas (numbers in millions of US dollars).
Date | Revenue | Operating Cash Flow | Net Income to Common Stock |
---|---|---|---|
2022-12-31 | 20.54166 | 0.599127 | 0.199938 |
2022-09-30 | 20.10201 | 0.147685 | -0.106023 |
2022-06-30 | 19.51709 | -2.225834 | -0.198929 |
2022-03-31 | 19.54978 | -1.860051 | -0.07815 |
2021-12-31 | 18.25657 | -2.551111 | -0.29915 |
2021-09-30 | 18.06231 | -1.232473 | -0.256183 |
UUU's Quality Factors
The “Quality” component of the POWR Ratings focuses on 31 different factors of a companies fundamentals and operational strength. Here are some key insights as we drill into the specifics of these quality attributes.- UUU has a Quality Grade of C, ranking ahead of 47.54% of graded US stocks.
- UUU's asset turnover comes in at 2.454 -- ranking 23rd of 105 Wholesale stocks.
- PDCO, VOXX, and DXPE are the stocks whose asset turnover ratios are most correlated with UUU.
The table below shows UUU's key quality metrics over time.
Period | Asset Turnover | Gross Margin | ROIC |
---|---|---|---|
2021-06-30 | 2.454 | 0.302 | 0.061 |
2021-03-31 | 2.261 | 0.322 | 0.049 |
2020-12-31 | 2.290 | 0.295 | -0.340 |
2020-09-30 | 1.599 | 0.284 | -0.429 |
2020-06-30 | 1.092 | 0.268 | -0.552 |
2020-03-31 | 0.977 | 0.254 | -0.534 |
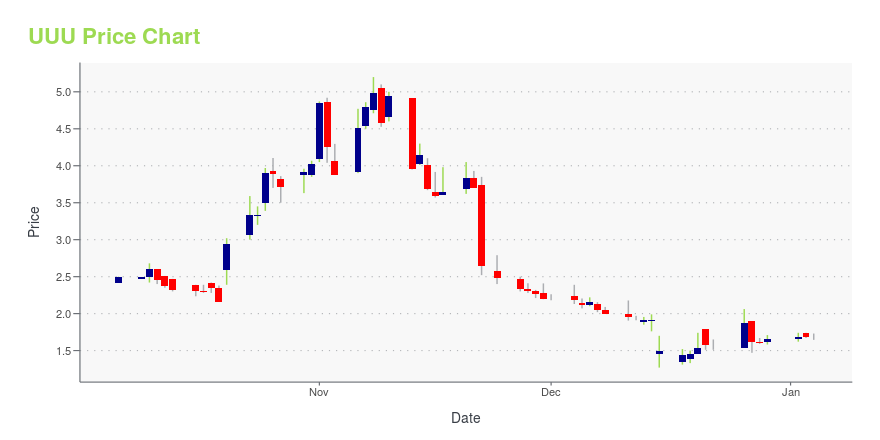
UUU Stock Price Chart Interactive Chart >
UUU Price/Volume Stats
Current price | $2.25 | 52-week high | $5.25 |
Prev. close | $2.23 | 52-week low | $1.50 |
Day low | $2.23 | Volume | 4,098 |
Day high | $2.30 | Avg. volume | 311,044 |
50-day MA | $2.30 | Dividend yield | N/A |
200-day MA | $3.03 | Market Cap | 5.20M |
Universal Security Instruments, Inc. (UUU) Company Bio
Universal Security Instruments, Inc. designs and markets a variety of security, telecommunications, and video products, as well as miscellaneous private label products. The Company produces products that are primarily designed for easy installation by the consumer. Universal imports virtually all of its products from various suppliers overseas.
Latest UUU News From Around the Web
Below are the latest news stories about UNIVERSAL SECURITY INSTRUMENTS INC that investors may wish to consider to help them evaluate UUU as an investment opportunity.
Today’s Biggest Pre-Market Stock Movers: 10 Top Gainers and Losers on FridayWe're starting off the final trading day of the week with a look at the biggest pre-market stock movers worth watching on Friday! |
Universal Security Instruments Reports Third-Quarter ResultsUniversal Security Instruments, Inc. (NYSE AMEX: UUU) today announced results for its fiscal third quarter and nine months ended December 31, 2022. |
Today’s Biggest Pre-Market Stock Movers: 10 Top Gainers and Losers on MondayWe're starting off the week with a breakdown of the biggest pre-market stock movers traders will want to watch for Monday! |
Universal Security Instruments Reports Second-Quarter ResultsOWINGS MILLS, Md., Nov. 21, 2022 (GLOBE NEWSWIRE) -- Universal Security Instruments, Inc. (NYSE AMEX: UUU) today announced results for its fiscal second quarter and six months ended September 30, 2022. For the three months ended September 30, 2022, sales increased 11.1% to $5,857,141 compared to sales of $5,272,223 for the same period last year. The Company reported net income of $200,602, or $0.09 per basic and diluted share, compared to net income of $107,696 or $0.05 per basic and diluted sha |
Universal Security Instruments Reports First-Quarter ResultsUniversal Security Instruments, Inc. (NYSE Amex: UUU) today announced results for its fiscal quarter ended June 30, 2022. |
UUU Price Returns
1-mo | -12.79% |
3-mo | 10.84% |
6-mo | -41.71% |
1-year | -47.06% |
3-year | 492.11% |
5-year | 59.57% |
YTD | 10.84% |
2022 | -40.29% |
2021 | -32.14% |
2020 | 708.06% |
2019 | -41.51% |
2018 | -37.65% |
Continue Researching UUU
Here are a few links from around the web to help you further your research on Universal Security Instruments Inc's stock as an investment opportunity:Universal Security Instruments Inc (UUU) Stock Price | Nasdaq
Universal Security Instruments Inc (UUU) Stock Quote, History and News - Yahoo Finance
Universal Security Instruments Inc (UUU) Stock Price and Basic Information | MarketWatch
Loading social stream, please wait...