Universal Corporation (UVV): Price and Financial Metrics
UVV Price/Volume Stats
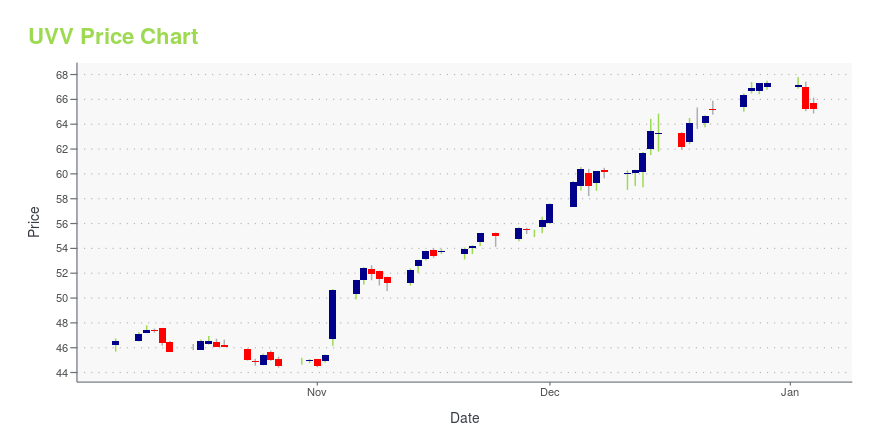
Current price | $47.21 | 52-week high | $57.83 |
Prev. close | $47.40 | 52-week low | $43.64 |
Day low | $46.96 | Volume | 127,700 |
Day high | $47.58 | Avg. volume | 126,933 |
50-day MA | $47.93 | Dividend yield | 6.83% |
200-day MA | $51.24 | Market Cap | 1.16B |
UVV Stock Price Chart Interactive Chart >
UVV POWR Grades
- Value is the dimension where UVV ranks best; there it ranks ahead of 83.8% of US stocks.
- The strongest trend for UVV is in Growth, which has been heading down over the past 177 days.
- UVV ranks lowest in Quality; there it ranks in the 16th percentile.
UVV Stock Summary
- UNIVERSAL CORP's stock had its IPO on January 5, 1988, making it an older stock than 89.88% of US equities in our set.
- Of note is the ratio of UNIVERSAL CORP's sales and general administrative expense to its total operating expenses; 87.23% of US stocks have a lower such ratio.
- The volatility of UNIVERSAL CORP's share price is greater than that of merely 4.45% US stocks with at least 200 days of trading history.
- Stocks that are quantitatively similar to UVV, based on their financial statements, market capitalization, and price volatility, are GTES, DLA, SON, MGRC, and BBCP.
- UVV's SEC filings can be seen here. And to visit UNIVERSAL CORP's official web site, go to www.universalcorp.com.
UVV Valuation Summary
- In comparison to the median Consumer Defensive stock, UVV's EV/EBIT ratio is 32.37% lower, now standing at 11.7.
- UVV's price/sales ratio has moved down 0 over the prior 243 months.
Below are key valuation metrics over time for UVV.
Stock | Date | P/S | P/B | P/E | EV/EBIT |
---|---|---|---|---|---|
UVV | 2023-09-22 | 0.4 | 0.9 | 10.2 | 11.7 |
UVV | 2023-09-21 | 0.4 | 0.9 | 10.3 | 11.8 |
UVV | 2023-09-20 | 0.4 | 0.9 | 10.3 | 11.7 |
UVV | 2023-09-19 | 0.4 | 0.9 | 10.3 | 11.7 |
UVV | 2023-09-18 | 0.4 | 0.8 | 10.1 | 11.6 |
UVV | 2023-09-15 | 0.4 | 0.9 | 10.2 | 11.7 |
UVV Growth Metrics
- The 4 year net income to common stockholders growth rate now stands at 243.13%.
- The 2 year cash and equivalents growth rate now stands at -24%.
- The 3 year net cashflow from operations growth rate now stands at -72.72%.

The table below shows UVV's growth in key financial areas (numbers in millions of US dollars).
Date | Revenue | Operating Cash Flow | Net Income to Common Stock |
---|---|---|---|
2022-12-31 | 2,522.818 | -87.392 | 96.115 |
2022-09-30 | 2,380.423 | -180.595 | 89.395 |
2022-06-30 | 2,183.394 | -53.966 | 87.05 |
2022-03-31 | 2,103.601 | 44.882 | 86.577 |
2021-12-31 | 2,074.218 | 130.215 | 100.168 |
2021-09-30 | 2,094.505 | 249.602 | 98.501 |
UVV's Quality Factors
The “Quality” component of the POWR Ratings focuses on 31 different factors of a companies fundamentals and operational strength. Here are some key insights as we drill into the specifics of these quality attributes.- UVV has a Quality Grade of D, ranking ahead of 15.18% of graded US stocks.
- UVV's asset turnover comes in at 0.861 -- ranking 86th of 105 Wholesale stocks.
- SPRS, KAMN, and NGL are the stocks whose asset turnover ratios are most correlated with UVV.
The table below shows UVV's key quality metrics over time.
Period | Asset Turnover | Gross Margin | ROIC |
---|---|---|---|
2021-06-30 | 0.861 | 0.196 | 0.065 |
2021-03-31 | 0.874 | 0.195 | 0.065 |
2020-12-31 | 0.902 | 0.186 | 0.051 |
2020-09-30 | 0.849 | 0.177 | 0.045 |
2020-06-30 | 0.897 | 0.182 | 0.058 |
2020-03-31 | 0.881 | 0.187 | 0.059 |
Universal Corporation (UVV) Company Bio
Universal Corporation operates as a leaf tobacco merchant and processor worldwide. It engages in procuring, financing, processing, packing, storing, and shipping leaf tobacco for sale to, or for the account of, manufacturers of consumer tobacco products. The company was founded in 1888 and is based in Richmond, Virginia.
Latest UVV News From Around the Web
Below are the latest news stories about UNIVERSAL CORP that investors may wish to consider to help them evaluate UVV as an investment opportunity.
3 Dividend Champions That Have Raised Their Payouts Every Year Since 2000 (or Earlier!)These dividend champions have raised their dividends consistently since 2000, and are among the top options for income investors. |
Universal Corporation (NYSE:UVV) Q1 2024 Earnings Call TranscriptUniversal Corporation (NYSE:UVV) Q1 2024 Earnings Call Transcript August 2, 2023 Operator: Good afternoon, ladies and gentlemen, and welcome to the Universal Corporation First Quarter Fiscal Year 2024 Earnings Conference Call. At this time, all lines are in a listen-only mode. Following the presentation, we will conduct a question-and-answer session. [Operator Instructions]. I would now […] |
Universal Corporation Reports First Quarter ResultsGeorge C. Freeman, III, Chairman, President, and Chief Executive Officer of Universal Corporation (NYSE:UVV), stated, "Our tobacco operations performed well and are off to a good start for our fiscal year 2024. Segment operating income was higher for our Tobacco Operations segment in the quarter ended June 30, 2023, compared to the quarter ended June 30, 2022, even though we did not have the benefit of large shipments of carryover tobacco from certain origins that we had in first quarter of fisc |
Universal Corporation Announces Quarterly DividendGeorge C. Freeman, III, Chairman, President, and Chief Executive Officer of Universal Corporation (NYSE:UVV), announced today that the Company's Board of Directors declared a quarterly dividend of eighty cents ($0.80) per share on the common shares of the Company, payable November 6, 2023, to common shareholders of record at the close of business on October 9, 2023. |
3 Consumer Staples Stocks With Dividends Yielding Over 4%Conagra Brands is a packaged foods company with well-known brands like Slim Jim, Healthy Choice, Marie Callender's, Orville Redenbacher's, Reddi Whip, Birds Eye, Vlasic, Hunt's, and PAM. On July 13, Conagra reported fourth-quarter FY 2023 results for the period ending May 28, 2023 (Conagra's fiscal year ends the last Sunday in May). Conagra has accelerated its dividend growth in recent years. |
UVV Price Returns
1-mo | -0.86% |
3-mo | -3.95% |
6-mo | -8.81% |
1-year | 9.20% |
3-year | 34.63% |
5-year | -2.32% |
YTD | -6.40% |
2022 | 1.82% |
2021 | 19.59% |
2020 | -8.96% |
2019 | 11.08% |
2018 | 7.79% |
UVV Dividends
Ex-Dividend Date | Type | Payout Amount | Change | ||||||
---|---|---|---|---|---|---|---|---|---|
Loading, please wait... |
Continue Researching UVV
Want to do more research on Universal Corp's stock and its price? Try the links below:Universal Corp (UVV) Stock Price | Nasdaq
Universal Corp (UVV) Stock Quote, History and News - Yahoo Finance
Universal Corp (UVV) Stock Price and Basic Information | MarketWatch
Loading social stream, please wait...