UWM Holdings Corporation (UWMC): Price and Financial Metrics
UWMC Price/Volume Stats
| Current price | $4.31 | 52-week high | $9.74 |
| Prev. close | $4.24 | 52-week low | $3.88 |
| Day low | $4.24 | Volume | 3,760,300 |
| Day high | $4.38 | Avg. volume | 4,617,343 |
| 50-day MA | $4.48 | Dividend yield | 9.52% |
| 200-day MA | $6.20 | Market Cap | 6.89B |
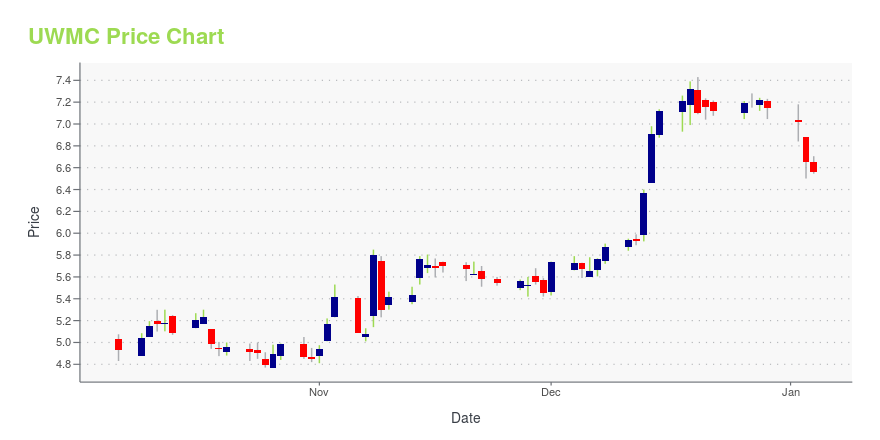
UWMC Stock Price Chart Interactive Chart >
UWM Holdings Corporation (UWMC) Company Bio
UWM Holdings Corporation operates as a holding company. The Company, through its subsidiaries, underwrites and provides closing documentation for residential mortgage loans originated by independent mortgage brokers, correspondents, small banks, and local credit unions.
UWMC Price Returns
| 1-mo | 1.41% |
| 3-mo | -24.17% |
| 6-mo | -25.90% |
| 1-year | -37.01% |
| 3-year | 40.37% |
| 5-year | -42.03% |
| YTD | -25.33% |
| 2024 | -13.06% |
| 2023 | 132.11% |
| 2022 | -38.03% |
| 2021 | -52.53% |
| 2020 | N/A |
UWMC Dividends
| Ex-Dividend Date | Type | Payout Amount | Change | ||||||
|---|---|---|---|---|---|---|---|---|---|
| Loading, please wait... | |||||||||


Loading social stream, please wait...