
Vacasa, Inc. (VCSA): Price and Financial Metrics
VCSA Price/Volume Stats
| Current price | $4.02 | 52-week high | $15.40 |
| Prev. close | $3.96 | 52-week low | $3.82 |
| Day low | $3.86 | Volume | 56,000 |
| Day high | $4.10 | Avg. volume | 86,370 |
| 50-day MA | $4.42 | Dividend yield | N/A |
| 200-day MA | $6.91 | Market Cap | 90.17M |
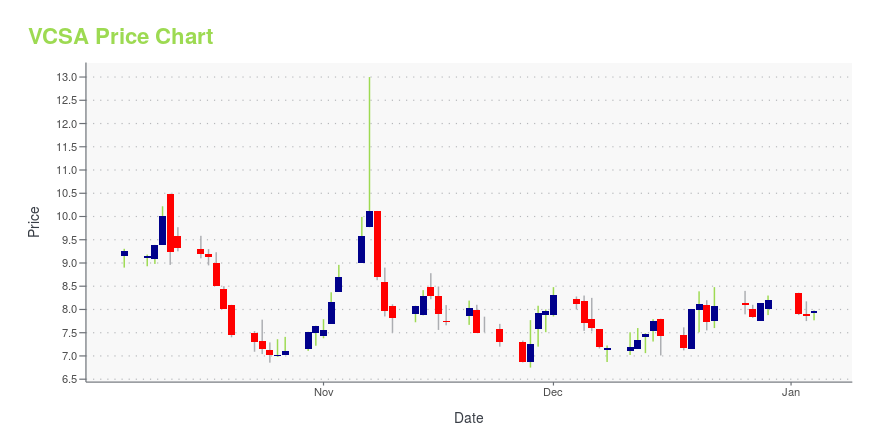
VCSA Stock Price Chart Interactive Chart >
Vacasa, Inc. (VCSA) Company Bio
Vacasa, Inc. operates vacation rental management platform in North America, Belize, and Costa Rica. The company enables guests to search, discover, and book its properties on Vacasa.com and the Vacasa Guest App. It also provides services to buy and sell vacation homes through its network of real estate agents. The company was founded in 2009 and is headquartered in Portland, Oregon.
Latest VCSA News From Around the Web
Below are the latest news stories about VACASA INC that investors may wish to consider to help them evaluate VCSA as an investment opportunity.
Matterport Signs Multi-Year Partnership with Vacasa to Provide Digital Twins for International Portfolio of Vacation HomesMatterport’s Property Marketing Solution will become an integral part of Vacasa’s home onboarding and guest experience for the tens of thousands of properties Vacasa managesSUNNYVALE, Calif., Nov. 30, 2023 (GLOBE NEWSWIRE) -- Matterport, Inc. (Nasdaq: MTTR), the leading digital twin platform to access, understand and utilize properties, and Vacasa, Inc. (Nasdaq: VCSA), North America’s leading vacation rental management platform, today announced a new multi-year partnership to leverage Matterport |
Vacasa Announces Third Quarter 2023 Financial ResultsPORTLAND, Ore., November 07, 2023--Vacasa, Inc. (Nasdaq: VCSA), North America’s leading vacation rental management platform, today announced its financial results for the quarter ended September 30, 2023. A shareholder letter containing the results can be found on the Company’s website at investors.vacasa.com. |
Vacasa to Announce Third Quarter 2023 Financial Results on November 7, 2023PORTLAND, Ore., October 24, 2023--Vacasa (Nasdaq: VCSA), North America’s leading vacation rental management platform, plans to report third quarter 2023 financial results after market close on Tuesday, November 7, 2023, followed by a conference call to discuss its results at 2:00 p.m. PT / 5:00 p.m. ET the same day. Chief Executive Officer Rob Greyber and Chief Financial Officer Bruce Schuman will host the conference call. |
Vacasa Announces Reverse Stock SplitPORTLAND, Ore., September 06, 2023--Vacasa, Inc. (Nasdaq: VCSA), North America’s leading vacation rental management platform (the "Company" or "Vacasa"), today announced that its board of directors has approved a reverse stock split of its Class A Common Stock, Class B Common Stock, and Class G Common Stock (collectively, the "Common Stock") at a ratio of 1-for-20. Stockholders approved a proposal to allow the board of directors, in its discretion, to effect a reverse stock split at the Annual M |
Vacasa Announces Second Quarter 2023 Financial ResultsPORTLAND, Ore., August 08, 2023--Vacasa, Inc. (Nasdaq: VCSA), North America’s leading vacation rental management platform, today announced its financial results for the quarter ended June 30, 2023. A shareholder letter containing the results can be found on the Company’s website at investors.vacasa.com. |
VCSA Price Returns
| 1-mo | -13.73% |
| 3-mo | -46.40% |
| 6-mo | -51.97% |
| 1-year | -71.69% |
| 3-year | N/A |
| 5-year | N/A |
| YTD | -50.98% |
| 2023 | -67.46% |
| 2022 | -84.86% |
| 2021 | N/A |
| 2020 | N/A |
| 2019 | N/A |
Loading social stream, please wait...