
Veeco Instruments Inc. (VECO): Price and Financial Metrics
VECO Price/Volume Stats
| Current price | $39.46 | 52-week high | $49.25 |
| Prev. close | $39.35 | 52-week low | $23.63 |
| Day low | $38.89 | Volume | 749,700 |
| Day high | $40.99 | Avg. volume | 593,252 |
| 50-day MA | $43.88 | Dividend yield | N/A |
| 200-day MA | $34.81 | Market Cap | 2.23B |
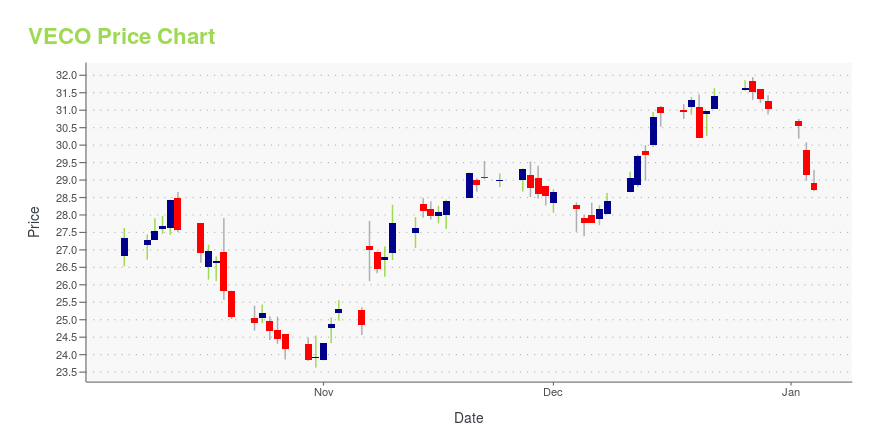
VECO Stock Price Chart Interactive Chart >
Veeco Instruments Inc. (VECO) Company Bio
Veeco Instruments designs, manufactures, and markets thin film equipment to make light emitting diodes, power electronics, wireless devices, hard disk drives, and semiconductors worldwide. The company was founded in 1945 and is based in Plainview, New York.
Latest VECO News From Around the Web
Below are the latest news stories about VEECO INSTRUMENTS INC that investors may wish to consider to help them evaluate VECO as an investment opportunity.
When Should You Buy Veeco Instruments Inc. (NASDAQ:VECO)?Veeco Instruments Inc. ( NASDAQ:VECO ), is not the largest company out there, but it received a lot of attention from a... |
Insider Sell Alert: Director Dennis St Sells 7,005 Shares of Veeco Instruments Inc (VECO)Veeco Instruments Inc (NASDAQ:VECO), a leading provider of semiconductor and thin film process equipment, has recently witnessed a notable insider sell by Director Dennis St. |
Zacks Industry Outlook Highlights Entegris, MKS Instruments and VeecoEntegris, MKS Instruments and Veeco have been highlighted in this Industry Outlook article. |
3 Electronics Stocks to Watch From a Challenging IndustryThe Zacks Electronics - Manufacturing Machinery industry participants like Entegris (ENTG), MKS Instruments (MKSI) and Veeco Instruments (VECO) are benefiting from increased capital spending on high-performance computing, advanced packaging and memory. |
Is Veeco Instruments (VECO) Stock Outpacing Its Computer and Technology Peers This Year?Here is how Veeco Instruments (VECO) and AppFolio (APPF) have performed compared to their sector so far this year. |
VECO Price Returns
| 1-mo | -13.90% |
| 3-mo | 12.23% |
| 6-mo | 21.60% |
| 1-year | 46.26% |
| 3-year | 80.26% |
| 5-year | 224.24% |
| YTD | 27.17% |
| 2023 | 67.01% |
| 2022 | -34.74% |
| 2021 | 64.00% |
| 2020 | 18.22% |
| 2019 | 98.18% |
Continue Researching VECO
Here are a few links from around the web to help you further your research on Veeco Instruments Inc's stock as an investment opportunity:Veeco Instruments Inc (VECO) Stock Price | Nasdaq
Veeco Instruments Inc (VECO) Stock Quote, History and News - Yahoo Finance
Veeco Instruments Inc (VECO) Stock Price and Basic Information | MarketWatch
Loading social stream, please wait...