Veeva Systems Inc. (VEEV): Price and Financial Metrics
VEEV Price/Volume Stats
Current price | $199.35 | 52-week high | $225.49 |
Prev. close | $203.95 | 52-week low | $151.02 |
Day low | $198.92 | Volume | 425,996 |
Day high | $203.66 | Avg. volume | 973,344 |
50-day MA | $201.30 | Dividend yield | N/A |
200-day MA | $183.23 | Market Cap | 32.03B |
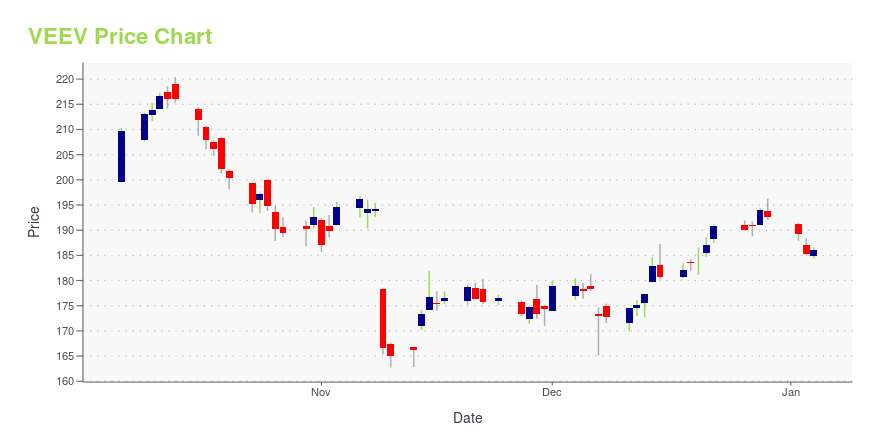
VEEV Stock Price Chart Interactive Chart >
VEEV POWR Grades
- VEEV scores best on the Quality dimension, with a Quality rank ahead of 94.49% of US stocks.
- The strongest trend for VEEV is in Stability, which has been heading down over the past 177 days.
- VEEV ranks lowest in Value; there it ranks in the 11th percentile.
VEEV Stock Summary
- VEEVA SYSTEMS INC's market capitalization of $32,635,562,333 is ahead of 92.99% of US-listed equities.
- VEEV's one year PEG ratio, measuring expected growth in earnings next year relative to current common stock price is 2,708.28 -- higher than 98.73% of US-listed equities with positive expected earnings growth.
- With a price/sales ratio of 14.62, VEEVA SYSTEMS INC has a higher such ratio than 93.2% of stocks in our set.
- Stocks with similar financial metrics, market capitalization, and price volatility to VEEVA SYSTEMS INC are WDAY, ALKT, MPWR, VRNS, and CRWD.
- VEEV's SEC filings can be seen here. And to visit VEEVA SYSTEMS INC's official web site, go to www.veeva.com.
VEEV Valuation Summary
- VEEV's price/sales ratio is 14.6; this is 265% higher than that of the median Healthcare stock.
- Over the past 121 months, VEEV's price/earnings ratio has gone down 964.4.
Below are key valuation metrics over time for VEEV.
Stock | Date | P/S | P/B | P/E | EV/EBIT |
---|---|---|---|---|---|
VEEV | 2023-09-22 | 14.6 | 7.9 | 60.4 | 63.4 |
VEEV | 2023-09-21 | 14.6 | 7.9 | 60.4 | 63.4 |
VEEV | 2023-09-20 | 15.1 | 8.1 | 62.3 | 65.4 |
VEEV | 2023-09-19 | 15.1 | 8.1 | 62.3 | 65.4 |
VEEV | 2023-09-18 | 15.0 | 8.1 | 61.9 | 65.0 |
VEEV | 2023-09-15 | 15.0 | 8.1 | 62.2 | 65.3 |
VEEV Growth Metrics
- The 3 year net income to common stockholders growth rate now stands at 59.07%.
- The 4 year price growth rate now stands at 217.28%.
- Its 2 year net income to common stockholders growth rate is now at 31.09%.

The table below shows VEEV's growth in key financial areas (numbers in millions of US dollars).
Date | Revenue | Operating Cash Flow | Net Income to Common Stock |
---|---|---|---|
2022-09-30 | 2,077.17 | 771.127 | 396.269 |
2022-06-30 | 2,000.93 | 741.426 | 393.681 |
2022-03-31 | 1,922.306 | 767.105 | 411.938 |
2021-12-31 | 1,850.777 | 764.463 | 427.39 |
2021-09-30 | 1,762.039 | 778.76 | 433.212 |
2021-06-30 | 1,663.447 | 761.204 | 424.302 |
VEEV's Quality Factors
The “Quality” component of the POWR Ratings focuses on 31 different factors of a companies fundamentals and operational strength. Here are some key insights as we drill into the specifics of these quality attributes.- VEEV has a Quality Grade of A, ranking ahead of 97.34% of graded US stocks.
- VEEV's asset turnover comes in at 0.545 -- ranking 298th of 561 Business Services stocks.
- WLDN, BNFT, and VSEC are the stocks whose asset turnover ratios are most correlated with VEEV.
The table below shows VEEV's key quality metrics over time.
Period | Asset Turnover | Gross Margin | ROIC |
---|---|---|---|
2021-07-31 | 0.545 | 0.726 | 0.455 |
2021-04-30 | 0.549 | 0.725 | 0.471 |
2021-01-31 | 0.555 | 0.721 | 0.453 |
2020-10-31 | 0.565 | 0.718 | 0.458 |
2020-07-31 | 0.564 | 0.720 | 0.508 |
2020-04-30 | 0.567 | 0.722 | 0.522 |
Veeva Systems Inc. (VEEV) Company Bio
Veeva Systems provides cloud-based software solutions for the life sciences industry in North America, Europe, the Asia Pacific, and Latin America. The company was founded in 2007 and is based in Pleasanton, California.
Latest VEEV News From Around the Web
Below are the latest news stories about VEEVA SYSTEMS INC that investors may wish to consider to help them evaluate VEEV as an investment opportunity.
3 Reasons to Hold Veeva Systems (VEEV) Stock in Your PortfolioVeeva Systems' (VEEV) strong product portfolio raises optimism about the stock. |
Insider Sell: Director Matthew Wallach Sells 5,000 Shares of Veeva Systems IncOn September 18, 2023, Director Matthew Wallach sold 5,000 shares of Veeva Systems Inc (NYSE:VEEV). |
2 No-Brainer Stocks That Could Make You RicherHere are two examples: HCA Healthcare (NYSE: HCA) and Veeva Systems (NYSE: VEEV). Building a network of medical facilities is capital intensive. HCA Healthcare has already done those things, so it is hard to see the company losing substantial market share. |
Top Stock Reports for Visa, Chubb & HCA HealthcareToday's Research Daily features new research reports on 16 major stocks, including Visa Inc. (V), Chubb Limited (CB) and HCA Healthcare, Inc. (HCA). |
Veeva Systems' (VEEV) New Release to Address Supply-Chain IssuesVeeva Systems' (VEEV) new cloud application is likely to improve efficiency and accelerate time-to-market by connecting systems and automating data aggregation, reviews and traceability. |
VEEV Price Returns
1-mo | 5.40% |
3-mo | 1.75% |
6-mo | 11.28% |
1-year | 26.18% |
3-year | -27.23% |
5-year | 86.87% |
YTD | 23.53% |
2022 | -36.83% |
2021 | -6.16% |
2020 | 93.55% |
2019 | 57.48% |
2018 | 61.58% |
Continue Researching VEEV
Want to do more research on Veeva Systems Inc's stock and its price? Try the links below:Veeva Systems Inc (VEEV) Stock Price | Nasdaq
Veeva Systems Inc (VEEV) Stock Quote, History and News - Yahoo Finance
Veeva Systems Inc (VEEV) Stock Price and Basic Information | MarketWatch
Loading social stream, please wait...