
Venus Concept Inc. (VERO): Price and Financial Metrics
VERO Price/Volume Stats
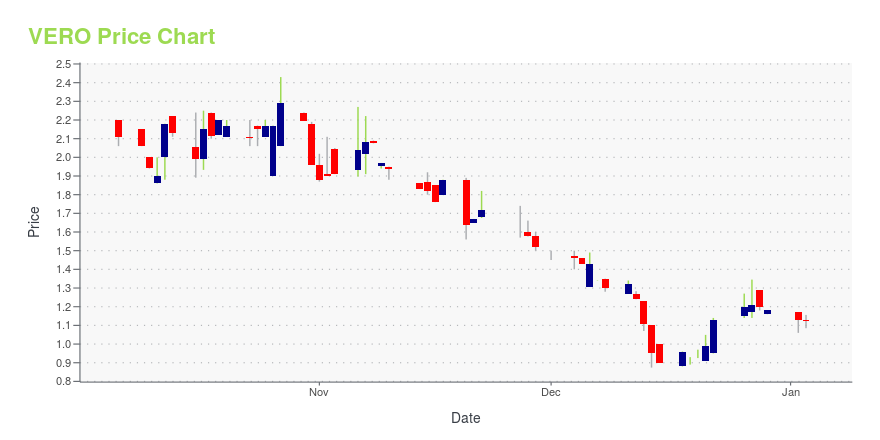
| Current price | $0.64 | 52-week high | $2.44 |
| Prev. close | $0.53 | 52-week low | $0.46 |
| Day low | $0.53 | Volume | 117,800 |
| Day high | $0.65 | Avg. volume | 902,207 |
| 50-day MA | $0.68 | Dividend yield | N/A |
| 200-day MA | $1.09 | Market Cap | 4.07M |
VERO Stock Price Chart Interactive Chart >
Venus Concept Inc. (VERO) Company Bio
Venus Concept Inc. (formerly Restoration Robotics, Inc.), a medical device company, develops and commercializes image-guided robotic systems in the United States and internationally. It offers ARTAS System, a physician-assisted robotic system that identifies and dissects hair follicular units directly from the scalp and creates recipient implant sites. The company was founded in 2002 and is based in San Jose, California.
Latest VERO News From Around the Web
Below are the latest news stories about VENUS CONCEPT INC that investors may wish to consider to help them evaluate VERO as an investment opportunity.
Venus Concept Announces Third Quarter of Fiscal Year 2023 Financial ResultsTORONTO, Nov. 14, 2023 (GLOBE NEWSWIRE) -- Venus Concept Inc. (“Venus Concept” or the “Company”) (NASDAQ: VERO), a global medical aesthetic technology leader, announced financial results for the three and nine months ended September 30, 2023. Third Quarter 2023 Summary & Recent Progress: Company continues to execute against Transformational Plan Total revenue of $17.6 million, down $3.9 million, or 18%, year-over-yearCash system revenue represented approximately 69% of total systems and subscrip |
Venus Concept Launches Venus Versa Pro, its new multi-application platform for face and body treatmentsTORONTO, Nov. 01, 2023 (GLOBE NEWSWIRE) -- Venus Concept Inc. ("Venus Concept" or the "Company") (NASDAQ: VERO), a global medical aesthetic technology leader, announced today the commercial launch of its new multi-application platform Venus Versa Pro in the United States. Venus Versa Pro supports 10 different applicators that can be used individually or in combination to target a wide range of aesthetic conditions, including skin texture, acne vulgaris, vascular and pigmented lesions, facial wri |
Venus Concept Launches New “Venus Aesthetic Intelligence” Branding and Updated “Venus.ai” Website to Reflect New Vision for the CompanyTORONTO, Oct. 17, 2023 (GLOBE NEWSWIRE) -- Venus Concept Inc. ("Venus Concept" or the "Company") (NASDAQ: VERO), a global medical aesthetic technology leader, announced today a company-wide rebranding initiative, introducing Venus Aesthetic Intelligence (or "Venus AI") to reflect its new strategic vision for the company and an enhanced focus on emerging technologies in aesthetics. "It has been a transformational year for the company. With the first phase of our strategic turnaround behind us, we |
Venus Concept Inc. Appoints Dr. Hemanth Varghese as President and Chief Operating Officer and Industry Veteran to Lead International OperationsTORONTO, Oct. 12, 2023 (GLOBE NEWSWIRE) -- Venus Concept Inc. (“Venus Concept” or the “Company”) (NASDAQ: VERO), a global medical aesthetic technology leader, today announced the promotion of Dr. Hemanth Varghese to the newly created role of President and Chief Operating Officer (COO), reporting to Chief Executive Officer, Rajiv De Silva, effective October 16, 2023. Dr. Varghese joined Venus Concept in October of 2022 as President and Chief Business Officer. His responsibilities were later expan |
Venus Concept to Release Third Quarter of Fiscal Year 2023 Financial Results on November 14, 2023TORONTO, Oct. 09, 2023 (GLOBE NEWSWIRE) -- Venus Concept Inc. (“Venus Concept” or the “Company”) (NASDAQ: VERO), a global medical aesthetic technology leader, announced today that third quarter of fiscal year 2023 financial results will be released after the market closes on Tuesday, November 14, 2023. Management will host a conference call at 5:00 p.m. Eastern Time on November 14, 2023 to discuss the results of the quarter with a question and answer session. Those who would like to participate |
VERO Price Returns
| 1-mo | -20.43% |
| 3-mo | -6.47% |
| 6-mo | -45.76% |
| 1-year | -66.93% |
| 3-year | -98.18% |
| 5-year | -99.97% |
| YTD | -45.76% |
| 2023 | -75.42% |
| 2022 | -81.18% |
| 2021 | -1.73% |
| 2020 | -63.19% |
| 2019 | -95.25% |
Loading social stream, please wait...