
Vertex Inc. Cl A (VERX): Price and Financial Metrics
VERX Price/Volume Stats
| Current price | $38.88 | 52-week high | $40.04 |
| Prev. close | $37.58 | 52-week low | $17.59 |
| Day low | $38.05 | Volume | 896,000 |
| Day high | $38.90 | Avg. volume | 795,259 |
| 50-day MA | $35.17 | Dividend yield | N/A |
| 200-day MA | $29.27 | Market Cap | 6.03B |
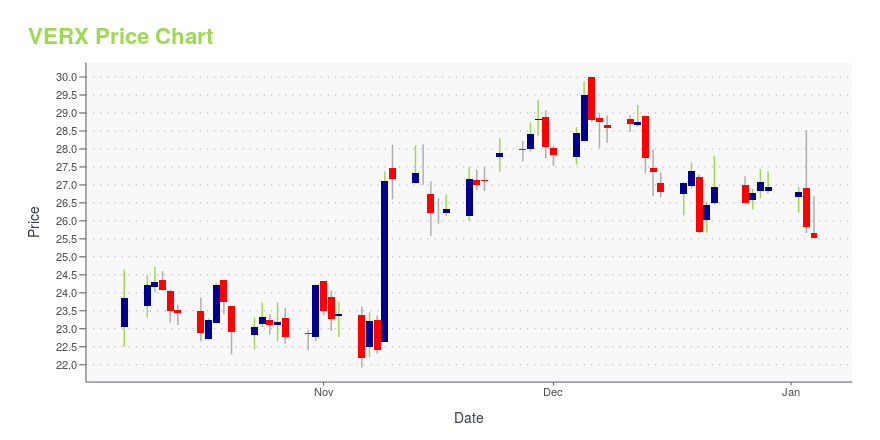
VERX Stock Price Chart Interactive Chart >
Vertex Inc. Cl A (VERX) Company Bio
For businesses that want more effective technology solutions, Vertex provides a comprehensive suite of software and consulting services for both income and transaction taxes that combine Vertex's 30 years of tax and technology experience with a fresh approach to tax consulting. As a provider of tax technology solutions for customers worldwide, Vertex offers solutions featuring products and services to help companies streamline tax compliance processes. With Vertex, you have a partner for discovering new strategic tax savings across every major line of business tax including income, sales, consumer use, value added, communications, and payroll.
Latest VERX News From Around the Web
Below are the latest news stories about VERTEX INC that investors may wish to consider to help them evaluate VERX as an investment opportunity.
Vertex Announces New Leadership with Three Strategic Appointments in Customer Success and Services, Tax Research and Global TalentKING OF PRUSSIA, Pa., Dec. 21, 2023 (GLOBE NEWSWIRE) -- Vertex, Inc. (NASDAQ:VERX) (“Vertex” or the “Company”), a global provider of tax technology solutions, announced today the appointment of three experienced leaders: Mindy Cunningham as SVP, Customer Success and Services; Jessica Nowlin, VP, Tax Research; and Angela Travagline VP, Global Talent and Organizational Effectiveness. The wealth of knowledge and skill set they bring will reinforce the company’s strategic focus on customer success, |
Vertex Inc CFO John Schwab Sells 25,000 SharesOn December 18, 2023, John Schwab, the Chief Financial Officer of Vertex Inc (VERX), sold 25,000 shares of the company's stock, according to a SEC Filing. |
Vertex Achieves Certified Integration with the Mirakl Marketplace PlatformVertex integration enables enterprise-class global indirect tax automation for Mirakl customers operating online marketplaces.KING OF PRUSSIA, Pa., Dec. 18, 2023 (GLOBE NEWSWIRE) -- Vertex, Inc. (NASDAQ:VERX) ("Vertex" or the "Company"), a global provider of tax technology solutions, and Mirakl, the global leader in platform business innovation, announced today the certified integration of Vertex® O Series® and the Mirakl Marketplace Platform. The solution seamlessly integrates with Mirakl’s pla |
Should You Investigate Vertex Resource Group Ltd. (CVE:VTX) At CA$0.40?While Vertex Resource Group Ltd. ( CVE:VTX ) might not be the most widely known stock at the moment, it received a lot... |
Vertex Stock Jumps on Hope for a Pain-Pill BlockbusterVertex promising new pain pill, which the company is testing as a potential alternative to opioids, reduced pain in patients with chronic neuropathic pain in a mid-stage trial, the company said Wednesday. Analysts say it could be a blockbuster if it reaches the market, but non-opioid pain drugs have a long history of failures in clinical trials. The announcement on Wednesday provides more evidence that Vertex could have an approvable drug, and perhaps a significant hit, on its hands. |
VERX Price Returns
| 1-mo | 10.74% |
| 3-mo | 31.66% |
| 6-mo | 55.46% |
| 1-year | 96.46% |
| 3-year | 110.73% |
| 5-year | N/A |
| YTD | 44.32% |
| 2023 | 85.67% |
| 2022 | -8.57% |
| 2021 | -54.46% |
| 2020 | N/A |
| 2019 | N/A |
Loading social stream, please wait...