
Vermilion Energy Inc. (VET): Price and Financial Metrics
VET Price/Volume Stats
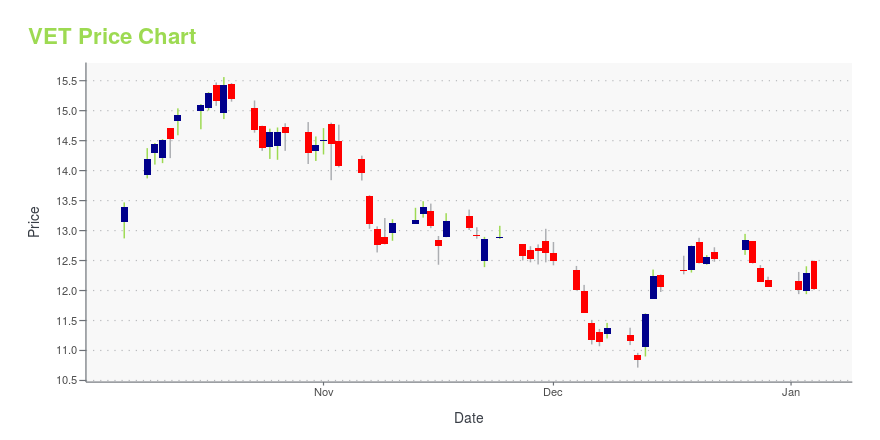
| Current price | $10.36 | 52-week high | $15.98 |
| Prev. close | $10.41 | 52-week low | $9.81 |
| Day low | $10.21 | Volume | 1,639,300 |
| Day high | $10.43 | Avg. volume | 1,142,741 |
| 50-day MA | $11.40 | Dividend yield | 3.31% |
| 200-day MA | $11.96 | Market Cap | 1.65B |
VET Stock Price Chart Interactive Chart >
Vermilion Energy Inc. (VET) Company Bio
Vermilion Energy acquires, explores, develops, and produces oil and natural gas in North America, Europe and Australia. The company was founded in 1994 and is based in Calgary, Canada.
Latest VET News From Around the Web
Below are the latest news stories about VERMILION ENERGY INC that investors may wish to consider to help them evaluate VET as an investment opportunity.
UPDATE 1-Vermilion Energy employee agrees to pay hefty penalty for insider tradingAn employee of Canadian oil and gas company Vermilion Energy has agreed to pay a C$400,000 ($302,755) penalty after admitting to illegal insider trading in a takeover target's shares, the Alberta Securities Commission said on Wednesday. Behjat Haghshenas, who was a senior reservoir specialist for Vermilion when it was in talks to acquire Leucrotta Exploration, has also agreed to a 10-year trading ban as part of a settlement agreement with the commission, the regulator said. Haghshenas admitted to illegal insider trading in the shares of Leucrotta before its acquisition by Vermilion, on which she made a profit of C$146,400. |
Vermilion Energy employee agrees to pay hefty penalty for insider trading(Reuters) -An employee of Canadian oil and gas company Vermilion Energy has agreed to pay a C$400,000 ($302,755) penalty after admitting to illegal insider trading in a takeover target's shares, the Alberta Securities Commission said on Wednesday. Behjat Haghshenas, who was a senior reservoir specialist for Vermilion when it was in talks to acquire Leucrotta Exploration, has also agreed to a 10-year trading ban as part of a settlement agreement with the commission, the regulator said. Haghshenas admitted to illegal insider trading in the shares of Leucrotta before its acquisition by Vermilion, on which she made a profit of C$146,400. |
Vermilion Energy employee pays C$400,000 to Alberta regulator for insider tradingAn employee of Canadian oil and gas company Vermilion Energy paid the securities regulator C$400,000 ($302,755.07), more than double the profit made by insider trading, the Alberta Securities Commission (ASC) said on Wednesday. Behjat Haghshenas, who was a senior reservoir specialist for Vermillion, admitted to illegal insider trading in the shares of oil and gas producer Leucrotta Exploration before its acquisition by Vermilion, according to the ASC. |
Should You Buy Vermilion Energy Inc. (TSE:VET) For Its Upcoming Dividend?Readers hoping to buy Vermilion Energy Inc. ( TSE:VET ) for its dividend will need to make their move shortly, as the... |
12 Most Profitable Cheap Stocks To BuyIn this piece, we will take a look at the 12 most profitable cheap stocks to buy. If you want to skip our coverage of the latest happenings in the renewable energy industry, then you can skip ahead to 5 Most Profitable Cheap Stocks To Buy. As investors seek to exit 2023 with the hopes […] |
VET Price Returns
| 1-mo | -6.77% |
| 3-mo | -13.63% |
| 6-mo | -3.58% |
| 1-year | -22.31% |
| 3-year | 51.05% |
| 5-year | -28.17% |
| YTD | -13.42% |
| 2023 | -30.28% |
| 2022 | 42.11% |
| 2021 | 182.92% |
| 2020 | -71.15% |
| 2019 | -13.38% |
VET Dividends
| Ex-Dividend Date | Type | Payout Amount | Change | ||||||
|---|---|---|---|---|---|---|---|---|---|
| Loading, please wait... | |||||||||
Continue Researching VET
Here are a few links from around the web to help you further your research on Vermilion Energy Inc's stock as an investment opportunity:Vermilion Energy Inc (VET) Stock Price | Nasdaq
Vermilion Energy Inc (VET) Stock Quote, History and News - Yahoo Finance
Vermilion Energy Inc (VET) Stock Price and Basic Information | MarketWatch
Loading social stream, please wait...