
Vicinity Motor Corp. (VEV): Price and Financial Metrics
VEV Price/Volume Stats
| Current price | $0.38 | 52-week high | $1.38 |
| Prev. close | $0.37 | 52-week low | $0.30 |
| Day low | $0.35 | Volume | 730,603 |
| Day high | $0.40 | Avg. volume | 922,047 |
| 50-day MA | $0.60 | Dividend yield | N/A |
| 200-day MA | $0.75 | Market Cap | 17.39M |
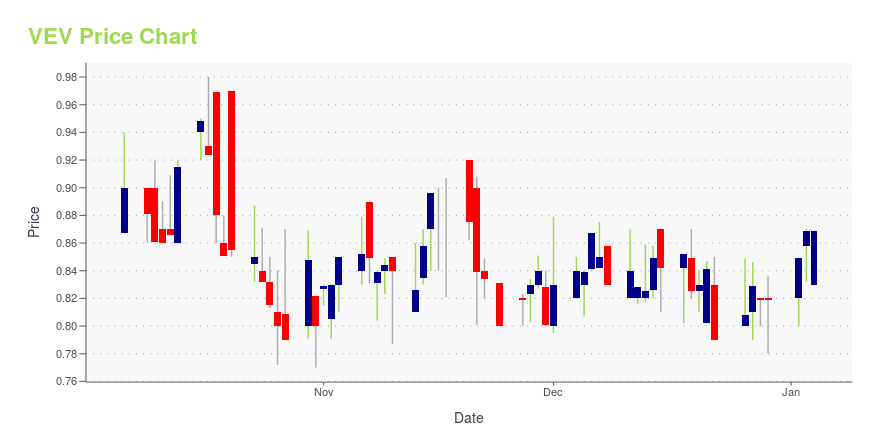
VEV Stock Price Chart Interactive Chart >
Vicinity Motor Corp. (VEV) Company Bio
Vicinity Motor Corp. engages in the provision of electric, CNG, gas and clean-diesel buses for both public and commercial enterprise use. It operates through the United States and Canada geographical segments. The company was founded by William Trainer in 2008 and is headquartered in Aldergrove, Canada.
Latest VEV News From Around the Web
Below are the latest news stories about VICINITY MOTOR CORP that investors may wish to consider to help them evaluate VEV as an investment opportunity.
Vicinity Motor Corp. Secures Order for 8 Vicinity(TM) Classic Clean Diesel Buses from La QuébécoiseVANCOUVER, BC / ACCESSWIRE / December 18, 2023 / Vicinity Motor Corp. (NASDAQ:VEV)(TSXV:VMC) ("Vicinity" or the "Company"), a North American supplier of commercial electric vehicles, today announced the receipt of a new purchase order from Autobus ... |
Vicinity Motor Corp. Announces Inclusion of VMC 1200 in Quebec Transportation Ministry's Incentive Program for Electric VehiclesÉcocamionnage Program to Offer CAD$85,000 Rebate to VMC 1200 Buyers in QuebecVANCOUVER, BC / ACCESSWIRE / December 4, 2023 / Vicinity Motor Corp. (NASDAQ:VEV)(TSXV:VMC) ("Vicinity" or the "Company"), a North American supplier of commercial electric ... |
Today’s Biggest Pre-Market Stock Movers: 10 Top Gainers and Losers on WednesdayPre-market stock movers are a hot topic on Wednesday as we check out all of the biggest movements happening this morning! |
Vicinity Motor Corp. Grants Stock OptionsVANCOUVER, BC / ACCESSWIRE / November 15, 2023 / Vicinity Motor Corp. (NASDAQ:VEV)(TSXV:VMC) ("Vicinity" or the "Company"), a North American supplier of commercial electric vehicles, announces the grant of 402,000 incentive stock options to its directors, ... |
Vicinity Motor Corp. Reports Third Quarter 2023 Financial ResultsNew Dealerships Expanding VMC 1200 Distribution Network Across North AmericaVANCOUVER, BC / ACCESSWIRE / November 13, 2023 / Vicinity Motor Corp. (NASDAQ:VEV)(TSXV:VMC) ("Vicinity" or the "Company"), a North American supplier of commercial electric ... |
VEV Price Returns
| 1-mo | -32.07% |
| 3-mo | -43.28% |
| 6-mo | -56.57% |
| 1-year | -68.46% |
| 3-year | -93.06% |
| 5-year | N/A |
| YTD | -53.60% |
| 2023 | -14.69% |
| 2022 | -72.57% |
| 2021 | -8.11% |
| 2020 | N/A |
| 2019 | N/A |
Loading social stream, please wait...