
Vector Group Ltd. (VGR): Price and Financial Metrics
VGR Price/Volume Stats
| Current price | $12.80 | 52-week high | $13.32 |
| Prev. close | $12.52 | 52-week low | $9.27 |
| Day low | $12.61 | Volume | 1,395,600 |
| Day high | $12.88 | Avg. volume | 1,218,623 |
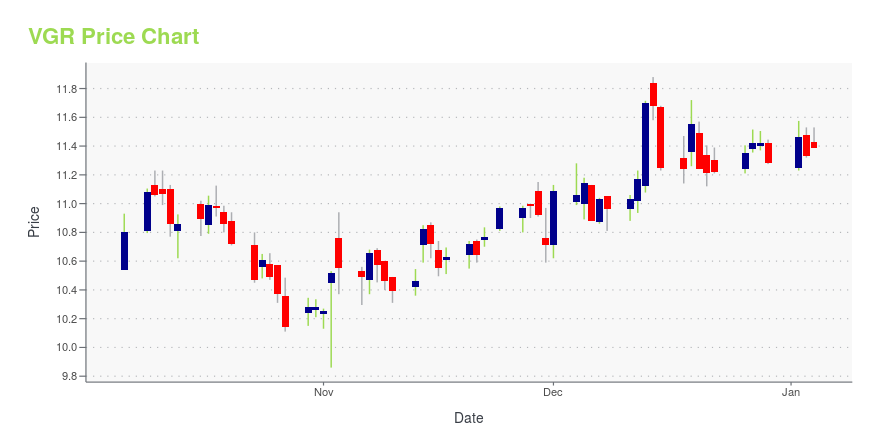
| 50-day MA | $11.07 | Dividend yield | 6.58% |
| 200-day MA | $10.83 | Market Cap | 2.01B |
VGR Stock Price Chart Interactive Chart >
Vector Group Ltd. (VGR) Company Bio
Vector Group Ltd. manufactures and sells cigarettes and electronic cigarettes in the United States. The company also provides residential brokerage services through a subsidiary. The company was founded in 1911 and is based in Miami, Florida.
Latest VGR News From Around the Web
Below are the latest news stories about VECTOR GROUP LTD that investors may wish to consider to help them evaluate VGR as an investment opportunity.
With 64% ownership of the shares, Vector Group Ltd. (NYSE:VGR) is heavily dominated by institutional ownersKey Insights Significantly high institutional ownership implies Vector Group's stock price is sensitive to their... |
Insider Sell Alert: Director Bennett Lebow Sells 171,054 Shares of Vector Group Ltd (VGR)Vector Group Ltd (NYSE:VGR) has recently witnessed a significant insider sell by Director Bennett Lebow, who offloaded 171,054 shares of the company on December 14, 2023. |
Current Analysis: Vector GroupOver the past year, Vector’s share price fell about 1.4% from $11.25 to $11.09 as of Friday’s market close. |
Interested In Vector Group's (NYSE:VGR) Upcoming US$0.20 Dividend? You Have Three Days LeftRegular readers will know that we love our dividends at Simply Wall St, which is why it's exciting to see Vector Group... |
11 Best Tobacco and Cigarette Stocks To BuyIn this article, we discuss 11 best tobacco and cigarette stocks to buy. If you want to skip our discussion on the tobacco industry, head directly to 5 Best Tobacco and Cigarette Stocks To Buy. The global tobacco market is expected to reach $1049.9 billion by 2030, with a compound annual growth rate (CAGR) of […] |
VGR Price Returns
| 1-mo | 18.52% |
| 3-mo | 26.91% |
| 6-mo | 21.98% |
| 1-year | 6.56% |
| 3-year | 65.21% |
| 5-year | 129.98% |
| YTD | 17.66% |
| 2023 | 1.92% |
| 2022 | 11.51% |
| 2021 | 44.66% |
| 2020 | -6.91% |
| 2019 | 58.14% |
VGR Dividends
| Ex-Dividend Date | Type | Payout Amount | Change | ||||||
|---|---|---|---|---|---|---|---|---|---|
| Loading, please wait... | |||||||||
Continue Researching VGR
Want to do more research on Vector Group Ltd's stock and its price? Try the links below:Vector Group Ltd (VGR) Stock Price | Nasdaq
Vector Group Ltd (VGR) Stock Quote, History and News - Yahoo Finance
Vector Group Ltd (VGR) Stock Price and Basic Information | MarketWatch
Loading social stream, please wait...