
Viavi Solutions Inc. (VIAV): Price and Financial Metrics
VIAV Price/Volume Stats
| Current price | $7.84 | 52-week high | $11.32 |
| Prev. close | $7.59 | 52-week low | $6.60 |
| Day low | $7.66 | Volume | 1,123,871 |
| Day high | $7.91 | Avg. volume | 1,889,957 |
| 50-day MA | $7.42 | Dividend yield | N/A |
| 200-day MA | $8.54 | Market Cap | 1.75B |
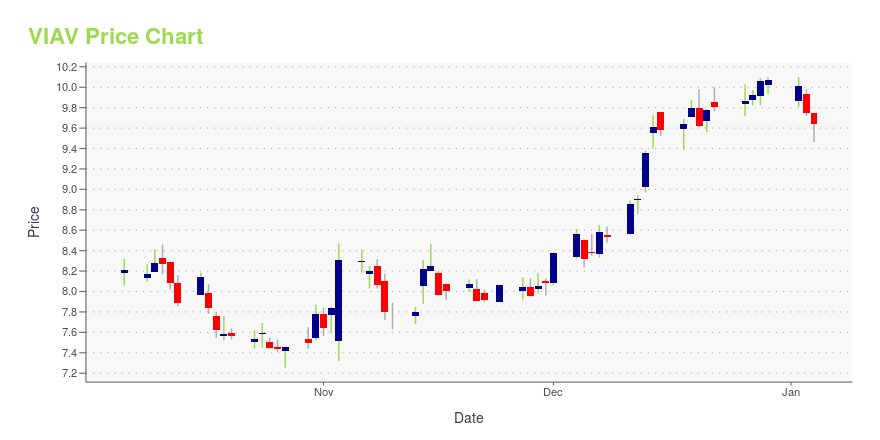
VIAV Stock Price Chart Interactive Chart >
Viavi Solutions Inc. (VIAV) Company Bio
Viavi Solutions engages in the network enablement, service enablement, and optical security and performance products businesses. Its software and hardware platforms and instruments deliver end-to-end visibility across physical, virtual, and hybrid networks. The company was founded in 1979 and is based in Milpitas, California.
Latest VIAV News From Around the Web
Below are the latest news stories about VIAVI SOLUTIONS INC that investors may wish to consider to help them evaluate VIAV as an investment opportunity.
Calculating The Intrinsic Value Of Viavi Solutions Inc. (NASDAQ:VIAV)Key Insights Using the 2 Stage Free Cash Flow to Equity, Viavi Solutions fair value estimate is US$8.27 Viavi... |
VIAVI Provides Benchmarking and Validation Across Eight Countries at Fall 2023 O-RAN PlugFestViavi Solutions Inc. (VIAVI) (NASDAQ: VIAV) today shared the company's role in the Fall 2023 O-RAN PlugFest organized by the O-RAN ALLIANCE and hosted by industry leaders. VIAVI delivered industry-leading benchmarking and validation for RAN Intelligent Controller (RIC) testing and training for AI-enabled applications including energy efficiency; security testing; and conformance and end-to-end testing of new products. The company also improved testing efficiency with real-time analysis and autom |
What Is Viavi Solutions Inc.'s (NASDAQ:VIAV) Share Price Doing?While Viavi Solutions Inc. ( NASDAQ:VIAV ) might not be the most widely known stock at the moment, it saw significant... |
VIAVI CTO Sameh Yamany Testifies at House Communications and Technology Subcommittee Hearing on "Leveraging AI to Enhance American Communications"VIAVI Solutions (NASDAQ: VIAV) today announced that Chief Technology Officer Dr. Sameh Yamany has testified at a hearing of the House Communications and Technology Subcommittee on "Leveraging AI to Enhance American Communications." Yamany's testimony described how low-risk, high-value AI systems used by VIAVI – which the company terms Telco AI – represent a new frontier in enhancing network security, resiliency, and efficiency, and that AI-driven solutions, especially those with limited to no in |
VIAVI Accelerates O-RAN Interoperability Testing with Industry's First Real-Time AnalyzerViavi Solutions Inc. (VIAVI) (NASDAQ: VIAV) today announced the expansion of its NITRO® Wireless portfolio with the addition of XhaulAdvisor, a scalable software solution offering real-time data for fronthaul verification, analysis, emulation and channel utilization. The first solution in the market to feature real-time analytics, XhaulAdvisor enables Open RAN vendors, operators and OTIC labs to accelerate interoperability testing (IOT) and End-to-End testing and troubleshooting. |
VIAV Price Returns
| 1-mo | 17.72% |
| 3-mo | -2.12% |
| 6-mo | -21.99% |
| 1-year | -27.61% |
| 3-year | -51.69% |
| 5-year | -46.78% |
| YTD | -22.14% |
| 2023 | -4.19% |
| 2022 | -40.35% |
| 2021 | 17.66% |
| 2020 | -0.17% |
| 2019 | 49.25% |
Continue Researching VIAV
Want to see what other sources are saying about Viavi Solutions Inc's financials and stock price? Try the links below:Viavi Solutions Inc (VIAV) Stock Price | Nasdaq
Viavi Solutions Inc (VIAV) Stock Quote, History and News - Yahoo Finance
Viavi Solutions Inc (VIAV) Stock Price and Basic Information | MarketWatch
Loading social stream, please wait...