
VICI Properties Inc. (VICI): Price and Financial Metrics
VICI Price/Volume Stats
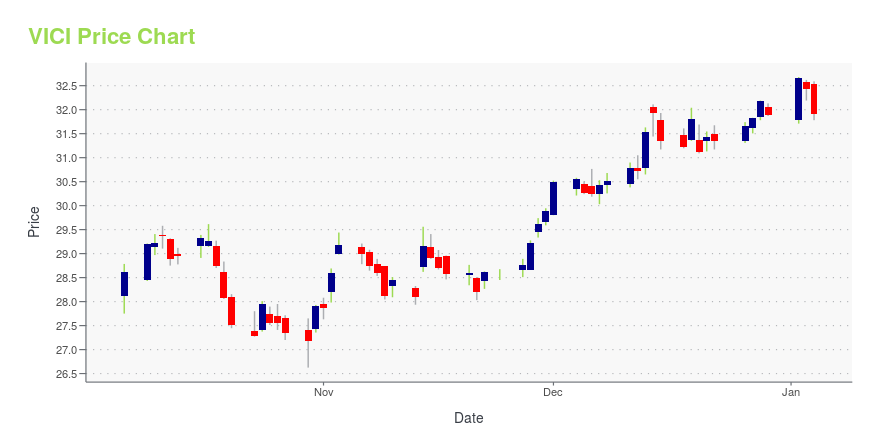
| Current price | $30.88 | 52-week high | $33.40 |
| Prev. close | $30.48 | 52-week low | $26.63 |
| Day low | $30.61 | Volume | 5,112,200 |
| Day high | $31.10 | Avg. volume | 6,263,748 |
| 50-day MA | $28.94 | Dividend yield | 5.45% |
| 200-day MA | $29.38 | Market Cap | 32.21B |
VICI Stock Price Chart Interactive Chart >
VICI Properties Inc. (VICI) Company Bio
Vici Properties Inc. is a real estate investment trust (REIT) specializing in casino properties, based in New York City. It was formed in 2017 as a spin-off from Caesars Entertainment Corporation as part of its bankruptcy reorganization. It owns 44 casinos, hotels, and racetracks and 4 golf courses throughout the United States. (Source:Wikipedia)
Latest VICI News From Around the Web
Below are the latest news stories about VICI PROPERTIES INC that investors may wish to consider to help them evaluate VICI as an investment opportunity.
15 Undervalued Defensive Stocks For 2024In this article, we discuss the 15 undervalued defensive stocks for 2024. To skip the detailed overview of the market and defensive stocks, go directly to the 5 Undervalued Defensive Stocks For 2024. Defensive stocks are shares of companies that remain relatively stable during economic downturns as opposed to cyclical stocks. Defensive stocks usually outperform […] |
VICI Properties Inc. CEO Edward Pitoniak Appears on Benzinga’s Real Estate WebinarNEW YORK, December 21, 2023--VICI Properties Inc. (NYSE: VICI) ("VICI Properties"), an experiential real estate investment trust, today announced that its CEO, Edward Pitoniak, appeared as a featured guest on Benzinga’s webinar titled "Real Estate Reimagined: Capitalizing on Unique Opportunities in a Changing Market" on Thursday, December 21, 2023. Mr. Pitoniak discussed the experiential real estate landscape as well as 2024 outlook. Click here to view the appearance. |
VICI Properties Inc. Announces Expanded Investments With Existing Partners Chelsea Piers and CabotNEW YORK, December 19, 2023--VICI Properties Inc. (NYSE: VICI) ("VICI Properties", "VICI" or the "Company") an experiential real estate investment trust, today announced the expansion of two experiential relationships with the acquisition of the leasehold interest of Chelsea Piers in New York City ("Chelsea Piers"), as well as an agreement with Cabot for a delayed draw loan facility in Saint Lucia and an agreement in principle to provide a delayed draw loan facility in Scotland, for potential to |
12 High Growth Dividend Paying Stocks To BuyIn this article, we discuss 12 high growth dividend stocks to buy. You can skip our detailed analysis of dividend stocks and their performance over the years, and go directly to read 5 High Growth Dividend Paying Stocks To Buy. Among some investors, there’s a perception or concern that allocating funds toward dividend payouts might […] |
VICI Properties Inc. Provides Construction Financing to Kalahari for Indoor Waterpark Resort Development in VirginiaNEW YORK, December 07, 2023--VICI Properties Inc. (NYSE: VICI) ("VICI Properties" or the "Company"), an experiential real estate investment trust, announced today that the Company has agreed to provide an up to $212 million mezzanine loan investment to Kalahari Resorts and Conventions ("Kalahari") to fund the development of a Kalahari indoor waterpark resort in Thornburg, Virginia ("Kalahari Virginia"). The 907-key, $900 million indoor waterpark resort officially broke ground in October 2023 and |
VICI Price Returns
| 1-mo | 10.33% |
| 3-mo | 10.09% |
| 6-mo | 4.59% |
| 1-year | 2.27% |
| 3-year | 13.53% |
| 5-year | 87.78% |
| YTD | -0.26% |
| 2023 | 3.58% |
| 2022 | 13.01% |
| 2021 | 23.77% |
| 2020 | 6.01% |
| 2019 | 43.23% |
VICI Dividends
| Ex-Dividend Date | Type | Payout Amount | Change | ||||||
|---|---|---|---|---|---|---|---|---|---|
| Loading, please wait... | |||||||||
Continue Researching VICI
Here are a few links from around the web to help you further your research on Vici Properties Inc's stock as an investment opportunity:Vici Properties Inc (VICI) Stock Price | Nasdaq
Vici Properties Inc (VICI) Stock Quote, History and News - Yahoo Finance
Vici Properties Inc (VICI) Stock Price and Basic Information | MarketWatch
Loading social stream, please wait...