
Vislink Technologies, Inc. (VISL): Price and Financial Metrics
VISL Price/Volume Stats
| Current price | $7.58 | 52-week high | $7.73 |
| Prev. close | $6.59 | 52-week low | $2.31 |
| Day low | $6.46 | Volume | 57,741 |
| Day high | $7.73 | Avg. volume | 18,030 |
| 50-day MA | $5.02 | Dividend yield | N/A |
| 200-day MA | $3.91 | Market Cap | 18.56M |
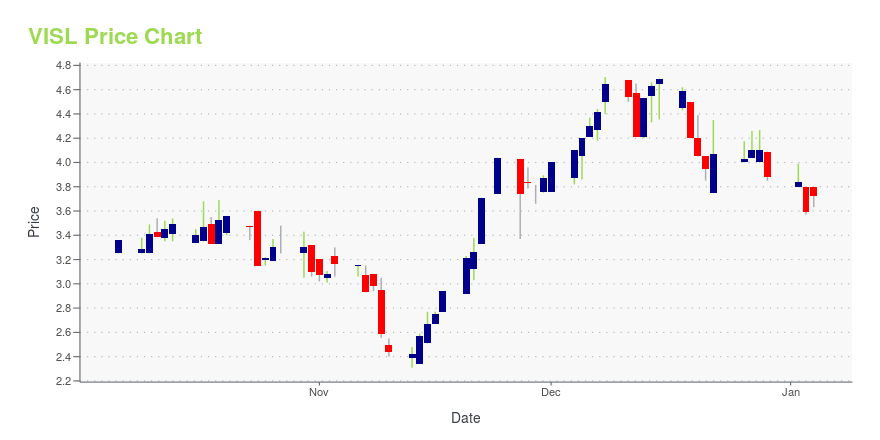
VISL Stock Price Chart Interactive Chart >
Vislink Technologies, Inc. (VISL) Company Bio
Vislink Technologies, Inc. produces and distributes wireless telecommunication equipment. The Company offers amplifiers, antennas, receivers, transmitters, and wireless camera systems. Vislink Technologies markets its products worldwide.
Latest VISL News From Around the Web
Below are the latest news stories about VISLINK TECHNOLOGIES INC that investors may wish to consider to help them evaluate VISL as an investment opportunity.
Vislink Technologies, Inc. (NASDAQ:VISL) Q3 2023 Earnings Call TranscriptVislink Technologies, Inc. (NASDAQ:VISL) Q3 2023 Earnings Call Transcript November 8, 2023 Vislink Technologies, Inc. misses on earnings expectations. Reported EPS is $-0.82704 EPS, expectations were $-0.8. Operator: Good afternoon. Welcome to Vislink’s Third Quarter 2023 Earnings Conference Call. My name is Alan and I will be your operator for today’s call. Joining us today […] |
Vislink Reports Third Quarter 2023 Financial and Operational ResultsBolstered Leading Position in Airborne Video Downlink Systems (AVDS) Market through Acquisition of Broadcast Microwave Services Assets Core MilGov Segment Revenue Increases 34% Year-Over-Year, Reaching $3.5 Million for the First Nine Months; Q3 Net Loss Improves 28% Year-Over-Year Mt. Olive, NJ, Nov. 08, 2023 (GLOBE NEWSWIRE) -- Vislink Technologies, Inc. (“Vislink” or the “Company”) (Nasdaq: VISL), a global technology leader in the capture, delivery, and management of high quality, live video a |
Vislink Provides Zoom Communications Leading-Edge Technology to Deliver Immersive Coverage of Major Indian Sporting Events of 2023Zoom Communications is India's First Outside Broadcast (OB) Service Provider to use Ultralow-Latency 4K Wireless Cameras Powered by Vislink’s Breakthrough Technology MT. OLIVE, NJ, Nov. 07, 2023 (GLOBE NEWSWIRE) -- Vislink Technologies, Inc. (NASDAQ: VISL), whose solutions cover almost every major sporting event across the world and enable seamless broadcasts to audiences of millions, announces that its wireless camera systems have now been chosen by Zoom Communications India. Zoom Communication |
Vislink to Showcase Public Safety Capabilities at the 2023 Milipol Paris ShowBreakthrough Technology for Mission-Critical Insights Across Military, Law Enforcement and Public Safety Applications on Display at Prestigious Homeland Security and Safety Event PARIS, FRANCE, Nov. 01, 2023 (GLOBE NEWSWIRE) -- Vislink Technologies, Inc. (NASDAQ: VISL), a global leader in the collection, delivery, management and distribution of high-quality live video and data, will join an accomplished group of industry decision-makers at the 2023 Milipol Paris Show, a four-day conference highl |
Vislink to Report Third Quarter 2023 Financial Results on Wednesday, November 8, 2023, at 4:30 p.m. ETMt. Olive, NJ, Oct. 26, 2023 (GLOBE NEWSWIRE) -- Vislink Technologies, Inc. (“Vislink” or the “Company”) (Nasdaq: VISL), a global technology leader in the capture, delivery, and management of high-quality live video and associated data in the media and entertainment, law enforcement, and defense markets, will hold a conference call on Wednesday, November 8, 2023, at 4:30 p.m. Eastern Time (1:30 p.m. Pacific Time) to discuss its financial results for the third quarter ended September 30, 2023. Fi |
VISL Price Returns
| 1-mo | 70.72% |
| 3-mo | 90.93% |
| 6-mo | 123.60% |
| 1-year | 35.36% |
| 3-year | -82.85% |
| 5-year | -93.75% |
| YTD | 95.36% |
| 2023 | -65.36% |
| 2022 | -52.54% |
| 2021 | -10.61% |
| 2020 | -13.56% |
| 2019 | -91.79% |
Continue Researching VISL
Want to do more research on Vislink Technologies Inc's stock and its price? Try the links below:Vislink Technologies Inc (VISL) Stock Price | Nasdaq
Vislink Technologies Inc (VISL) Stock Quote, History and News - Yahoo Finance
Vislink Technologies Inc (VISL) Stock Price and Basic Information | MarketWatch
Loading social stream, please wait...