
Vista Oil & Gas S.A.B. de C.V. ADR (VIST): Price and Financial Metrics
VIST Price/Volume Stats
| Current price | $44.59 | 52-week high | $50.01 |
| Prev. close | $44.25 | 52-week low | $23.73 |
| Day low | $44.14 | Volume | 200,164 |
| Day high | $45.31 | Avg. volume | 548,469 |
| 50-day MA | $45.59 | Dividend yield | N/A |
| 200-day MA | $37.34 | Market Cap | 4.29B |
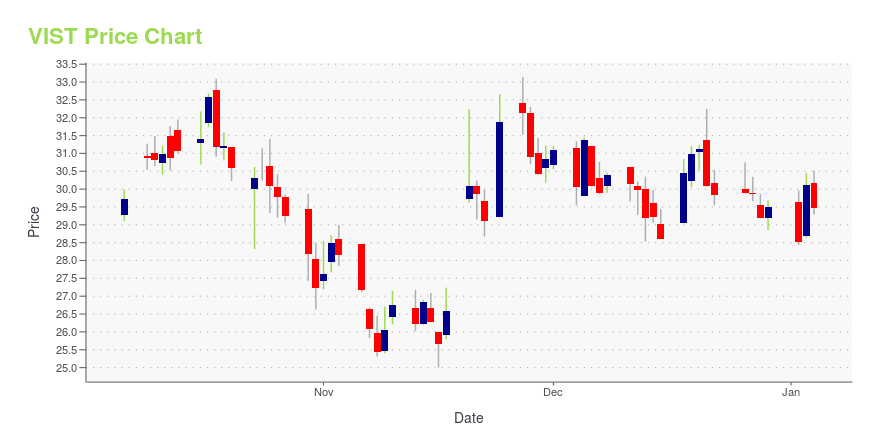
VIST Stock Price Chart Interactive Chart >
Vista Oil & Gas S.A.B. de C.V. ADR (VIST) Company Bio
Vista Oil & Gas SA de CV is an oil and gas company. It engages in exploration and production of oil & gas. The company was founded on March 22, 2017 and is headquartered in Mexico City.
Latest VIST News From Around the Web
Below are the latest news stories about VISTA ENERGY SAB DE CV that investors may wish to consider to help them evaluate VIST as an investment opportunity.
Is Vista Oil & Gas (VIST) Stock Outpacing Its Oils-Energy Peers This Year?Here is how Vista Oil & Gas, S.A.B. de C.V. Sponsored ADR (VIST) and Williams Companies, Inc. (The) (WMB) have performed compared to their sector so far this year. |
What Makes Vista Oil & Gas, S.A.B. de C.V. Sponsored ADR (VIST) a Good Fit for 'Trend Investing'Vista Oil & Gas, S.A.B. de C.V. Sponsored ADR (VIST) could be a great choice for investors looking to make a profit from fundamentally strong stocks that are currently on the move. It is one of the several stocks that made it through our "Recent Price Strength" screen. |
10 Best Performing Energy Stocks In 2023In this piece, we will take a look at the ten best performing energy stocks in 2023. If you want to skip our overview of the energy industry and some top players, take a look at the 5 Best Performing Energy Stocks In 2023. With 2023 coming to a close, one truth has stood the […] |
Is Vista Oil & Gas (VIST) Outperforming Other Oils-Energy Stocks This Year?Here is how Vista Oil & Gas, S.A.B. de C.V. Sponsored ADR (VIST) and Williams Companies, Inc. (The) (WMB) have performed compared to their sector so far this year. |
12 Best Nuclear Energy Stocks To Buy TodayIn this piece, we will take a look at the 12 best nuclear energy stocks to buy today. If you want to skip our introduction to the nuclear energy industry and some recent trends, then take a look at 5 Best Nuclear Energy Stocks To Buy Today. These days, the nuclear energy industry is experimenting […] |
VIST Price Returns
| 1-mo | -1.17% |
| 3-mo | 3.60% |
| 6-mo | 34.39% |
| 1-year | 76.11% |
| 3-year | 951.65% |
| 5-year | 390.00% |
| YTD | 51.10% |
| 2023 | 88.44% |
| 2022 | 193.81% |
| 2021 | 108.20% |
| 2020 | -67.39% |
| 2019 | N/A |
Loading social stream, please wait...