Valmont Industries, Inc. (VMI): Price and Financial Metrics

Valmont Industries, Inc. (VMI): $224.72

1.01 (+0.45%)

POWR Rating

Component Grades

Momentum

A

Stability

C

Sentiment

Quality

C

Add VMI to Watchlist
Sign Up

Industry: Industrial - Metals

Industry

C

Ranked

#9 of 33

in industry

VMI Price/Volume Stats

Current price $224.72 52-week high $345.65
Prev. close $223.71 52-week low $188.63
Day low $222.68 Volume 34,188
Day high $227.68 Avg. volume 161,293
50-day MA $219.65 Dividend yield 1.07%
200-day MA $266.30 Market Cap 4.69B

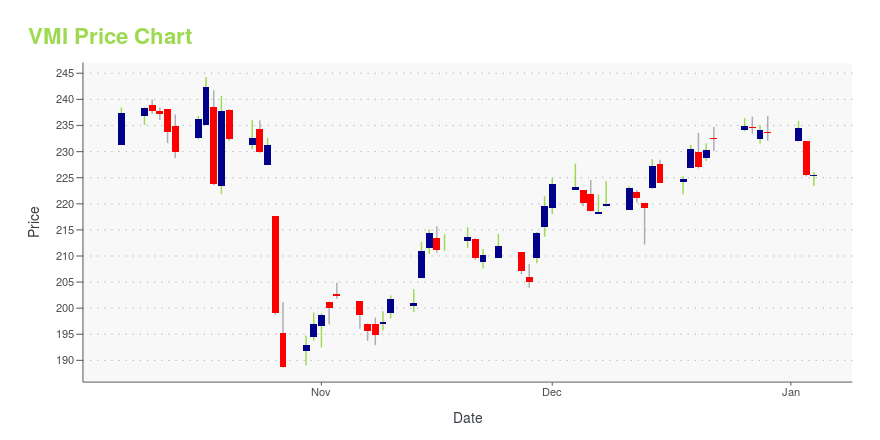
VMI Stock Price Chart Interactive Chart >

VMI POWR Grades

  • Momentum is the dimension where VMI ranks best; there it ranks ahead of 98.68% of US stocks.
  • The strongest trend for VMI is in Growth, which has been heading down over the past 177 days.
  • VMI's current lowest rank is in the Sentiment metric (where it is better than 16.3% of US stocks).

VMI Stock Summary

  • VMI has a higher market value than 74.06% of US stocks; more precisely, its current market capitalization is $4,214,889,272.
  • VALMONT INDUSTRIES INC's capital turnover -- a measure of revenue relative to shareholder's equity -- is better than 81.25% of US listed stocks.
  • VMI's went public 33.66 years ago, making it older than 85.3% of listed US stocks we're tracking.
  • If you're looking for stocks that are quantitatively similar to VALMONT INDUSTRIES INC, a group of peers worth examining would be JHG, THO, AMN, BCC, and HLIO.
  • VMI's SEC filings can be seen here. And to visit VALMONT INDUSTRIES INC's official web site, go to www.valmont.com.

VMI Valuation Summary

  • VMI's price/sales ratio is 1; this is 42.86% lower than that of the median Industrials stock.
  • VMI's price/earnings ratio has moved up 7.1 over the prior 243 months.

Below are key valuation metrics over time for VMI.

Stock Date P/S P/B P/E EV/EBIT
VMI 2023-11-09 1.0 2.7 26.6 16.0
VMI 2023-11-08 0.9 2.7 26.2 15.9
VMI 2023-11-07 1.0 2.7 26.3 15.9
VMI 2023-11-06 1.0 2.8 26.8 16.1
VMI 2023-11-03 1.0 2.6 15.4 11.6
VMI 2023-11-02 1.0 2.6 15.2 11.5

VMI Growth Metrics

    Its 4 year net cashflow from operations growth rate is now at 107.33%.
  • Its 5 year revenue growth rate is now at 7.28%.
  • Its 5 year net cashflow from operations growth rate is now at 107.33%.
Over the past 33 months, VMI's revenue has gone up $1,410,036,000.

The table below shows VMI's growth in key financial areas (numbers in millions of US dollars).

Date Revenue Operating Cash Flow Net Income to Common Stock
2022-09-30 4,177.012 187.835 237.387
2022-06-30 3,948.412 63.772 216.925
2022-03-31 3,707.509 35.488 202.927
2021-12-31 3,501.575 65.938 195.63
2021-09-30 3,336.674 105.077 204.589
2021-06-30 3,201.862 235.735 192.281

VMI's Quality Factors

The “Quality” component of the POWR Ratings focuses on 31 different factors of a companies fundamentals and operational strength. Here are some key insights as we drill into the specifics of these quality attributes.
  • VMI has a Quality Grade of C, ranking ahead of 40.54% of graded US stocks.
  • VMI's asset turnover comes in at 1.045 -- ranking 20th of 60 Construction Materials stocks.
  • GIFI, PATK, and DOOR are the stocks whose asset turnover ratios are most correlated with VMI.

The table below shows VMI's key quality metrics over time.

Period Asset Turnover Gross Margin ROIC
2021-09-25 1.045 0.260 0.127
2021-06-26 1.042 0.259 0.127
2021-03-27 1.023 0.262 0.113
2020-12-26 1.010 0.264 0.107
2020-09-26 0.986 0.263 0.107
2020-06-27 0.988 0.262 0.108

VMI Price Target

For more insight on analysts targets of VMI, see our VMI price target page. And for a list of of all stocks sorted by upside potential based on analyst target price, see our Top Price Target page.

Average Price Target $283.00 Average Broker Recommendation 1.33 (Strong Buy)

Valmont Industries, Inc. (VMI) Company Bio


Valmont Industries produces and sells fabricated metal products in the United States and internationally. It operates in four segments: Engineered Infrastructure Products, Utility Support Structures, Coatings, and Irrigation. The company was founded in 1946 and is based in Omaha, Nebraska.


VMI Latest News Stream


Event/Time News Detail
Loading, please wait...

VMI Latest Social Stream


Loading social stream, please wait...

View Full VMI Social Stream

Latest VMI News From Around the Web

Below are the latest news stories about VALMONT INDUSTRIES INC that investors may wish to consider to help them evaluate VMI as an investment opportunity.

What Is Valmont Industries, Inc.'s (NYSE:VMI) Share Price Doing?

While Valmont Industries, Inc. ( NYSE:VMI ) might not be the most widely known stock at the moment, it received a lot...

Yahoo | November 13, 2023

Valmont Industries, Inc. (NYSE:VMI) Q3 2023 Earnings Call Transcript

Valmont Industries, Inc. (NYSE:VMI) Q3 2023 Earnings Call Transcript October 26, 2023 Operator: Greetings. Welcome to Valmont Industries Third Quarter 2023 Earnings Conference Call. [Operator Instructions]. I will now turn the conference over to your host, Renee Campbell, Senior Vice President, Investor Relations and Treasurer. Ms. Campbell, you may begin. Renee Campbell: Thank you, and […]

Yahoo | October 27, 2023

Valmont's (VMI) Q3 Earnings Top Estimates, Revenues Lag

Valmont's (VMI) third-quarter earnings top estimates on higher volumes in the infrastructure segment on solid market demand.

Yahoo | October 26, 2023

Valmont Industries Inc (VMI) Reports Q3 2023 Earnings and Updates Full-Year Financial Outlook

Company experiences growth in Infrastructure segment, faces challenges in Agriculture segment

Yahoo | October 26, 2023

Valmont (VMI) Reports Q3 Earnings: What Key Metrics Have to Say

While the top- and bottom-line numbers for Valmont (VMI) give a sense of how the business performed in the quarter ended September 2023, it could be worth looking at how some of its key metrics compare to Wall Street estimates and year-ago values.

Yahoo | October 25, 2023

Read More 'VMI' Stories Here

VMI Price Returns

1-mo 11.11%
3-mo -8.57%
6-mo -19.87%
1-year -34.73%
3-year 36.20%
5-year N/A
YTD -31.61%
2022 33.13%
2021 44.43%
2020 18.62%
2019 36.52%
2018 -32.34%

VMI Dividends

Ex-Dividend Date Type Payout Amount Change
Loading, please wait...
View Full VMI Dividend History

Continue Researching VMI

Here are a few links from around the web to help you further your research on Valmont Industries Inc's stock as an investment opportunity:

Valmont Industries Inc (VMI) Stock Price | Nasdaq
Valmont Industries Inc (VMI) Stock Quote, History and News - Yahoo Finance
Valmont Industries Inc (VMI) Stock Price and Basic Information | MarketWatch

Get Free Updates

Join thousands of investors who get the latest news, insights and top rated picks from StockNews.com!