Vanda Pharmaceuticals Inc. (VNDA): Price and Financial Metrics
GET POWR RATINGS... FREE!
VNDA POWR Grades
- VNDA scores best on the Value dimension, with a Value rank ahead of 99.89% of US stocks.
- VNDA's strongest trending metric is Sentiment; it's been moving up over the last 177 days.
- VNDA's current lowest rank is in the Growth metric (where it is better than 17.17% of US stocks).
VNDA Stock Summary
- With a price/earnings ratio of 68.25, VANDA PHARMACEUTICALS INC P/E ratio is greater than that of about 91.45% of stocks in our set with positive earnings.
- For VNDA, its debt to operating expenses ratio is greater than that reported by merely 9.44% of US equities we're observing.
- Equity multiplier, or assets relative to shareholders' equity, comes in at 1.2 for VANDA PHARMACEUTICALS INC; that's greater than it is for only 13.42% of US stocks.
- Stocks with similar financial metrics, market capitalization, and price volatility to VANDA PHARMACEUTICALS INC are ACLS, SCKT, MDRX, JKHY, and VIAV.
- VNDA's SEC filings can be seen here. And to visit VANDA PHARMACEUTICALS INC's official web site, go to www.vandapharma.com.
VNDA Valuation Summary
- In comparison to the median Healthcare stock, VNDA's price/sales ratio is 66.67% lower, now standing at 1.7.
- Over the past 205 months, VNDA's price/sales ratio has gone NA NA.
Below are key valuation metrics over time for VNDA.
Stock | Date | P/S | P/B | P/E | EV/EBIT |
---|---|---|---|---|---|
VNDA | 2023-01-30 | 1.7 | 0.8 | 66.3 | 37.8 |
VNDA | 2023-01-27 | 1.7 | 0.8 | 66.7 | 38.1 |
VNDA | 2023-01-26 | 1.7 | 0.8 | 67.0 | 38.3 |
VNDA | 2023-01-25 | 1.7 | 0.8 | 66.9 | 38.2 |
VNDA | 2023-01-24 | 1.7 | 0.8 | 66.8 | 38.2 |
VNDA | 2023-01-23 | 1.7 | 0.8 | 66.8 | 38.2 |
VNDA Growth Metrics
- The year over year cash and equivalents growth rate now stands at -7.22%.
- Its 5 year net cashflow from operations growth rate is now at 513.47%.
- Its 2 year net income to common stockholders growth rate is now at -84.51%.

The table below shows VNDA's growth in key financial areas (numbers in millions of US dollars).
Date | Revenue | Operating Cash Flow | Net Income to Common Stock |
---|---|---|---|
2022-09-30 | 257.919 | 49.175 | 6.492 |
2022-06-30 | 262.696 | 45.735 | 10.993 |
2022-03-31 | 266.205 | 59.067 | 18.072 |
2021-12-31 | 268.682 | 64.214 | 33.152 |
2021-09-30 | 268.316 | 56.909 | 34.264 |
2021-06-30 | 258.529 | 56.886 | 32.44 |
VNDA's Quality Factors
The “Quality” component of the POWR Ratings focuses on 31 different factors of a companies fundamentals and operational strength. Here are some key insights as we drill into the specifics of these quality attributes.- VNDA has a Quality Grade of B, ranking ahead of 90.12% of graded US stocks.
- VNDA's asset turnover comes in at 0.483 -- ranking 88th of 682 Pharmaceutical Products stocks.
- NEOG, CLVS, and AMRN are the stocks whose asset turnover ratios are most correlated with VNDA.
The table below shows VNDA's key quality metrics over time.
Period | Asset Turnover | Gross Margin | ROIC |
---|---|---|---|
2021-09-30 | 0.483 | 0.904 | 0.107 |
2021-06-30 | 0.479 | 0.904 | 0.105 |
2021-03-31 | 0.482 | 0.904 | 0.107 |
2020-12-31 | 0.486 | 0.906 | 0.086 |
2020-09-30 | 0.484 | 0.904 | 0.073 |
2020-06-30 | 0.493 | 0.900 | 0.085 |
VNDA Price Target
For more insight on analysts targets of VNDA, see our VNDA price target page. And for a list of of all stocks sorted by upside potential based on analyst target price, see our Top Price Target page.
Average Price Target | $24.00 | Average Broker Recommendation | 1 (Strong Buy) |
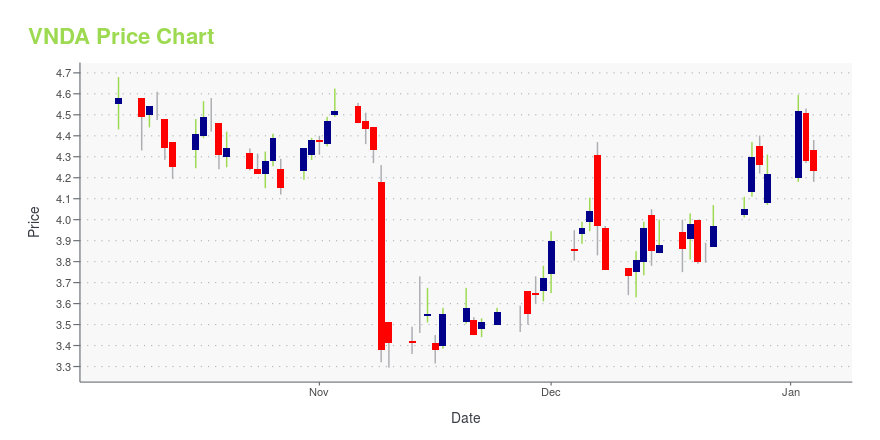
VNDA Stock Price Chart Interactive Chart >
VNDA Price/Volume Stats
Current price | $7.65 | 52-week high | $14.15 |
Prev. close | $7.83 | 52-week low | $6.73 |
Day low | $7.58 | Volume | 594,000 |
Day high | $7.87 | Avg. volume | 557,087 |
50-day MA | $8.34 | Dividend yield | N/A |
200-day MA | $9.84 | Market Cap | 432.91M |
Vanda Pharmaceuticals Inc. (VNDA) Company Bio
Vanda Pharmaceuticals is a biopharmaceutical company focused on the development and commercialization of products for the treatment of central nervous system disorders. The company was founded in 2002 and is based in Washington, the District of Columbia.
Latest VNDA News From Around the Web
Below are the latest news stories about VANDA PHARMACEUTICALS INC that investors may wish to consider to help them evaluate VNDA as an investment opportunity.
Vanda Pharmaceuticals to Announce Fourth Quarter and Full Year 2022 Financial Results on February 8, 2023Vanda Pharmaceuticals Inc. (Vanda) (Nasdaq: VNDA) today announced it will release results for the fourth quarter and full year 2022 on Wednesday, February 8, 2023, after the market closes. |
Are Vanda Pharmaceuticals Inc.'s (NASDAQ:VNDA) Fundamentals Good Enough to Warrant Buying Given The Stock's Recent Weakness?It is hard to get excited after looking at Vanda Pharmaceuticals' (NASDAQ:VNDA) recent performance, when its stock has... |
Vanda Pharmaceuticals Announces Participation in the J.P. Morgan Healthcare ConferenceVanda Pharmaceuticals Inc. (Vanda) (Nasdaq: VNDA) today announced that the company will participate in the J.P. Morgan Healthcare Conference in San Francisco, California on Thursday, January 12, 2023. A corporate presentation is scheduled for 12:00 p.m. Pacific Time (3:00 p.m. Eastern Time). |
Vanda Pharmaceuticals says its schizophrenia drug works in bipolar disorder“We believe this is really critical data to ask for an FDA approval,” said Vanda’s president and CEO. |
Vanda Pharma's Antipsychotic Shows Improved Severity In Bipolar DisorderVanda Pharmaceuticals Inc (NASDAQ: VNDA) reported results from a Phase 3 study of Fanapt (iloperidone tablets), a novel atypical antipsychotic, in acute manic and mixed episodes associated with bipolar I disorder in adults. Fanapt is currently approved by the FDA for schizophrenia in adults. In the clinical study VP-VYV-683-3201, approximately 400 volunteers with a history of bipolar I disorder suffering from a current episode of mania were randomized to receive either Fanapt or a placebo. The p |
VNDA Price Returns
1-mo | 3.10% |
3-mo | -26.58% |
6-mo | -27.49% |
1-year | -36.41% |
3-year | -42.48% |
5-year | -51.43% |
YTD | 3.52% |
2022 | -52.90% |
2021 | 19.41% |
2020 | -19.93% |
2019 | -37.20% |
2018 | 71.91% |
Continue Researching VNDA
Want to do more research on Vanda Pharmaceuticals Inc's stock and its price? Try the links below:Vanda Pharmaceuticals Inc (VNDA) Stock Price | Nasdaq
Vanda Pharmaceuticals Inc (VNDA) Stock Quote, History and News - Yahoo Finance
Vanda Pharmaceuticals Inc (VNDA) Stock Price and Basic Information | MarketWatch
Loading social stream, please wait...