Vishay Precision Group, Inc. (VPG): Price and Financial Metrics
VPG Price/Volume Stats
Current price | $33.48 | 52-week high | $45.69 |
Prev. close | $33.00 | 52-week low | $29.52 |
Day low | $33.18 | Volume | 43,900 |
Day high | $33.64 | Avg. volume | 55,362 |
50-day MA | $35.48 | Dividend yield | N/A |
200-day MA | $38.44 | Market Cap | 455.46M |
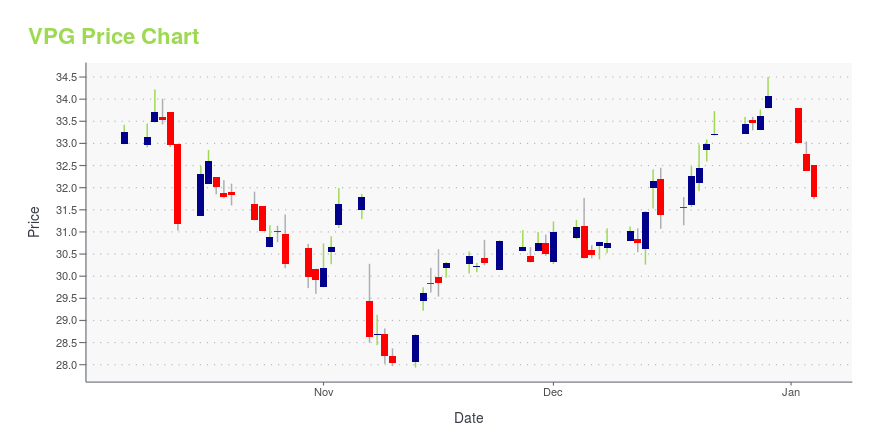
VPG Stock Price Chart Interactive Chart >
VPG POWR Grades
- Sentiment is the dimension where VPG ranks best; there it ranks ahead of 99.29% of US stocks.
- VPG's strongest trending metric is Growth; it's been moving down over the last 177 days.
- VPG's current lowest rank is in the Growth metric (where it is better than 33.17% of US stocks).
VPG Stock Summary
- Of note is the ratio of VISHAY PRECISION GROUP INC's sales and general administrative expense to its total operating expenses; 85.55% of US stocks have a lower such ratio.
- Equity multiplier, or assets relative to shareholders' equity, comes in at 1.54 for VISHAY PRECISION GROUP INC; that's greater than it is for 26.67% of US stocks.
- The volatility of VISHAY PRECISION GROUP INC's share price is greater than that of 28.01% US stocks with at least 200 days of trading history.
- Stocks with similar financial metrics, market capitalization, and price volatility to VISHAY PRECISION GROUP INC are SCS, PSMT, ARC, STRT, and PGTI.
- VPG's SEC filings can be seen here. And to visit VISHAY PRECISION GROUP INC's official web site, go to vpgsensors.com.
VPG Valuation Summary
- VPG's price/sales ratio is 1.2; this is 53.85% lower than that of the median Technology stock.
- VPG's EV/EBIT ratio has moved down 0.2 over the prior 161 months.
Below are key valuation metrics over time for VPG.
Stock | Date | P/S | P/B | P/E | EV/EBIT |
---|---|---|---|---|---|
VPG | 2023-09-22 | 1.2 | 1.4 | 13.1 | 9.1 |
VPG | 2023-09-21 | 1.2 | 1.4 | 13.0 | 9.0 |
VPG | 2023-09-20 | 1.2 | 1.4 | 13.0 | 9.0 |
VPG | 2023-09-19 | 1.2 | 1.4 | 13.4 | 9.3 |
VPG | 2023-09-18 | 1.3 | 1.4 | 13.4 | 9.3 |
VPG | 2023-09-15 | 1.3 | 1.4 | 13.5 | 9.4 |
VPG Growth Metrics
- Its 4 year price growth rate is now at 27.98%.
- Its 4 year net cashflow from operations growth rate is now at 113.36%.
- Its 5 year revenue growth rate is now at 20.62%.

The table below shows VPG's growth in key financial areas (numbers in millions of US dollars).
Date | Revenue | Operating Cash Flow | Net Income to Common Stock |
---|---|---|---|
2022-09-30 | 356.357 | 35.971 | 33.19 |
2022-06-30 | 348.274 | 29.915 | 28.451 |
2022-03-31 | 334.995 | 27.641 | 21.616 |
2021-12-31 | 317.919 | 33.537 | 20.221 |
2021-09-30 | 303.347 | 30.56 | 14.378 |
2021-06-30 | 288.898 | 30.996 | 14.597 |
VPG's Quality Factors
The “Quality” component of the POWR Ratings focuses on 31 different factors of a companies fundamentals and operational strength. Here are some key insights as we drill into the specifics of these quality attributes.- VPG has a Quality Grade of C, ranking ahead of 59.12% of graded US stocks.
- VPG's asset turnover comes in at 0.707 -- ranking 103rd of 208 Electronic Equipment stocks.
- NSSC, FLEX, and EMKR are the stocks whose asset turnover ratios are most correlated with VPG.
The table below shows VPG's key quality metrics over time.
Period | Asset Turnover | Gross Margin | ROIC |
---|---|---|---|
2021-07-03 | 0.707 | 0.396 | 0.086 |
2021-04-03 | 0.691 | 0.395 | 0.084 |
2020-12-31 | 0.699 | 0.386 | 0.082 |
2020-09-26 | 0.697 | 0.378 | 0.080 |
2020-06-27 | 0.719 | 0.373 | 0.080 |
2020-03-28 | 0.774 | 0.377 | 0.115 |
VPG Price Target
For more insight on analysts targets of VPG, see our VPG price target page. And for a list of of all stocks sorted by upside potential based on analyst target price, see our Top Price Target page.
Average Price Target | $47.13 | Average Broker Recommendation | 1.25 (Strong Buy) |
Vishay Precision Group, Inc. (VPG) Company Bio
Vishay Precision Group, Inc. designs, manufactures, and markets sensors, sensor-based measurement systems, specialty resistors, and strain gages based upon its proprietary technology in Asia, the United States, the United Kingdom, Israel, Europe, and Canada. The company is based in Malvern, Pennsylvania.
Latest VPG News From Around the Web
Below are the latest news stories about VISHAY PRECISION GROUP INC that investors may wish to consider to help them evaluate VPG as an investment opportunity.
Sidoti Events, LLC’s Virtual September Small-Cap ConferenceSidoti Events, LLC, an affiliate of Sidoti & Company, LLC, has released the presentation schedule and weblinks for its two-day September Small-Cap Conference taking place Wednesday and Thursday, September 20-21, 2023. The presentation schedule is subject to change. |
VPG to Participate in the Sidoti September 2023 Small-Cap Investor ConferenceMALVERN, Pa., Sept. 13, 2023 (GLOBE NEWSWIRE) -- Vishay Precision Group, Inc. (NYSE: VPG), a leader in precision measurement and sensing technologies, announced that the company will present at the Sidoti June Small-Cap Virtual Investor Conference on Thursday, September 21, 2023 at 9:15 a.m. ET. A live and on-demand webcast of VPG’s presentation will be available to the public and can be accessed from the following link: https://sidoti.zoom.us/webinar/VPG, or on VPG’s website: ir.vpgsensors.com/ |
When Should You Buy Vishay Precision Group, Inc. (NYSE:VPG)?Vishay Precision Group, Inc. ( NYSE:VPG ), might not be a large cap stock, but it received a lot of attention from a... |
Slowing Rates Of Return At Vishay Precision Group (NYSE:VPG) Leave Little Room For ExcitementIf you're not sure where to start when looking for the next multi-bagger, there are a few key trends you should keep an... |
VPG to Present at the Jefferies 2023 Industrials Conference on September 6, 2023MALVERN, Pa., Aug. 14, 2023 (GLOBE NEWSWIRE) -- Vishay Precision Group, Inc. (NYSE: VPG), a leader in precision measurement and sensing technologies, announced that the company will present at the Jefferies 2023 Industrials Conference in New York, NY on September 6, 2023 at 9:00 a.m. ET. A live and on-demand webcast of VPG’s presentation will be available to the public and can be accessed from the following link: https://wsw.com/webcast/jeff286/vpg/1717695, or on VPG’s website: ir.vpgsensors.com |
VPG Price Returns
1-mo | -6.22% |
3-mo | -9.88% |
6-mo | -19.83% |
1-year | 8.03% |
3-year | 34.08% |
5-year | -10.48% |
YTD | -13.38% |
2022 | 4.12% |
2021 | 17.92% |
2020 | -7.41% |
2019 | 12.47% |
2018 | 20.20% |
Continue Researching VPG
Want to do more research on Vishay Precision Group Inc's stock and its price? Try the links below:Vishay Precision Group Inc (VPG) Stock Price | Nasdaq
Vishay Precision Group Inc (VPG) Stock Quote, History and News - Yahoo Finance
Vishay Precision Group Inc (VPG) Stock Price and Basic Information | MarketWatch
Loading social stream, please wait...