
ViewRay, Inc. (VRAY): Price and Financial Metrics
VRAY Price/Volume Stats
| Current price | $0.03 | 52-week high | $4.96 |
| Prev. close | $0.04 | 52-week low | $0.02 |
| Day low | $0.02 | Volume | 108,502,700 |
| Day high | $0.04 | Avg. volume | 7,510,055 |
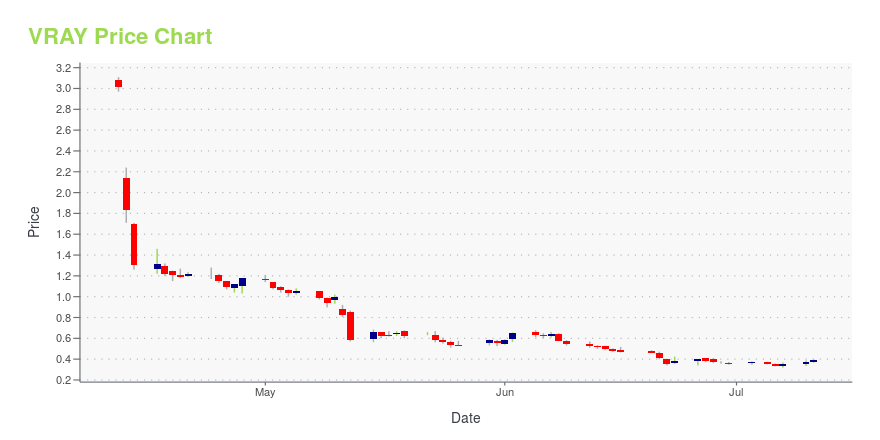
| 50-day MA | $0.43 | Dividend yield | N/A |
| 200-day MA | $2.97 | Market Cap | 4.59M |
VRAY Stock Price Chart Interactive Chart >
ViewRay, Inc. (VRAY) Company Bio
ViewRay, Inc. designs, manufactures, and markets radiation therapy systems worldwide. It offers MRIdian, a MRI-guided radiation therapy system that images and treats cancer patients simultaneously. MRIdian integrates MRI technology, radiation delivery, and proprietary software to locate, target, and track the position and shape of soft-tissue tumors while radiation is delivered. The company markets its MRIdian through a direct sales force in the United States and distributors worldwide to a range of customers, including university research and teaching hospitals, community hospitals, private practices, government institutions, and freestanding cancer centers. ViewRay, Inc. was founded in 2004 and is based in Oakwood Village, Ohio.
Latest VRAY News From Around the Web
Below are the latest news stories about VIEWRAY INC that investors may wish to consider to help them evaluate VRAY as an investment opportunity.
VA Oklahoma City Healthcare System Chooses ViewRay's MRIdian® MRI-Guided Radiation Therapy SystemViewRay, Inc. (Nasdaq: VRAY) announced today that the VA Oklahoma City Healthcare System has selected MRIdian MRI-guided radiation therapy system to expand radiation therapy services at the Oklahoma City VA Medical Center. This will be the first cancer center in Oklahoma and the fourth VA medical center offering Veterans access to MRIdian's advanced MRI-guided radiation therapy to treat cancer. The MRIdian system will enable the Oklahoma City VA Medical Center to provide precision MRI-guided rad |
Do You Believe in the Growth Prospects of ViewRay (VRAY)?Baron Funds, an investment management company, released its “Baron Discovery Fund” first quarter 2023 investor letter. A copy of the same can be downloaded here. The fund was up 11.20% in the first quarter compared to the Russell 2000 Growth Index’s return of 6.07%. The strong performance of holdings in the Information Technology (IT), Industrials, and […] |
ViewRay's MRIdian® to be Featured at Leading European Radiation Oncology MeetingViewRay, Inc. (Nasdaq: VRAY) announced today that the company's MRIdian MRI-guided radiation therapy system will be featured at the Annual Meeting of the European Society for Radiotherapy and Oncology (ESTRO) with over 50 presentations and posters highlighting MRIdian clinical and research experience. This year's ESTRO meeting will be held May 12-16, 2023, in Vienna, Austria. |
Need To Know: The Consensus Just Cut Its ViewRay, Inc. (NASDAQ:VRAY) Estimates For 2023The latest analyst coverage could presage a bad day for ViewRay, Inc. ( NASDAQ:VRAY ), with the analysts making... |
Q1 2023 ViewRay Inc Earnings CallQ1 2023 ViewRay Inc Earnings Call |
VRAY Price Returns
| 1-mo | N/A |
| 3-mo | N/A |
| 6-mo | N/A |
| 1-year | N/A |
| 3-year | -99.53% |
| 5-year | -99.68% |
| YTD | N/A |
| 2023 | 0.00% |
| 2022 | -18.69% |
| 2021 | 44.24% |
| 2020 | -9.48% |
| 2019 | -30.48% |
Continue Researching VRAY
Here are a few links from around the web to help you further your research on ViewRay Inc's stock as an investment opportunity:ViewRay Inc (VRAY) Stock Price | Nasdaq
ViewRay Inc (VRAY) Stock Quote, History and News - Yahoo Finance
ViewRay Inc (VRAY) Stock Price and Basic Information | MarketWatch
Loading social stream, please wait...