Varonis Systems, Inc. (VRNS): Price and Financial Metrics
GET POWR RATINGS... FREE!
VRNS Price/Volume Stats
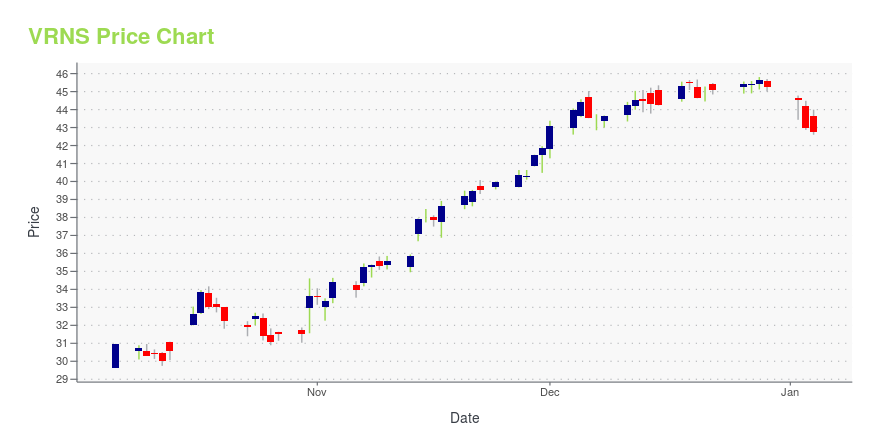
Current price | $25.65 | 52-week high | $35.38 |
Prev. close | $25.02 | 52-week low | $15.61 |
Day low | $25.01 | Volume | 551,300 |
Day high | $26.02 | Avg. volume | 1,079,994 |
50-day MA | $24.65 | Dividend yield | N/A |
200-day MA | $25.11 | Market Cap | 2.81B |
VRNS Stock Price Chart Interactive Chart >
VRNS POWR Grades
- Growth is the dimension where VRNS ranks best; there it ranks ahead of 90.67% of US stocks.
- VRNS's strongest trending metric is Growth; it's been moving up over the last 179 days.
- VRNS ranks lowest in Stability; there it ranks in the 30th percentile.
VRNS Stock Summary
- VRNS has a higher market value than 67.92% of US stocks; more precisely, its current market capitalization is $2,824,001,603.
- Price to trailing twelve month operating cash flow for VRNS is currently 116.89, higher than 97.03% of US stocks with positive operating cash flow.
- VRNS's price/sales ratio is 5.83; that's higher than the P/S ratio of 81.88% of US stocks.
- Stocks that are quantitatively similar to VRNS, based on their financial statements, market capitalization, and price volatility, are PD, MODN, OKTA, FROG, and OLO.
- VRNS's SEC filings can be seen here. And to visit VARONIS SYSTEMS INC's official web site, go to www.varonis.com.
VRNS Valuation Summary
- VRNS's EV/EBIT ratio is -24.2; this is 214.42% lower than that of the median Technology stock.
- VRNS's price/sales ratio has moved down 8.4 over the prior 112 months.
Below are key valuation metrics over time for VRNS.
Stock | Date | P/S | P/B | P/E | EV/EBIT |
---|---|---|---|---|---|
VRNS | 2023-05-22 | 5.7 | 5.7 | -24.2 | -24.2 |
VRNS | 2023-05-19 | 5.6 | 5.6 | -23.8 | -23.9 |
VRNS | 2023-05-18 | 5.6 | 5.7 | -23.9 | -23.9 |
VRNS | 2023-05-17 | 5.4 | 5.5 | -23.1 | -23.1 |
VRNS | 2023-05-16 | 5.4 | 5.4 | -22.8 | -22.8 |
VRNS | 2023-05-15 | 5.5 | 5.5 | -23.3 | -23.4 |
VRNS Growth Metrics
- The year over year revenue growth rate now stands at 31.38%.
- The 4 year revenue growth rate now stands at 44.53%.
- The 5 year cash and equivalents growth rate now stands at 51.82%.

The table below shows VRNS's growth in key financial areas (numbers in millions of US dollars).
Date | Revenue | Operating Cash Flow | Net Income to Common Stock |
---|---|---|---|
2022-12-31 | 473.634 | 11.871 | -124.518 |
2022-09-30 | 457.595 | 8.775 | -138.713 |
2022-06-30 | 434.64 | 6.108 | -133.31 |
2022-03-31 | 411.61 | 11.337 | -129.968 |
2021-12-31 | 390.134 | 7.178 | -116.861 |
2021-09-30 | 358.753 | 14.494 | -110.95 |
VRNS's Quality Factors
The “Quality” component of the POWR Ratings focuses on 31 different factors of a companies fundamentals and operational strength. Here are some key insights as we drill into the specifics of these quality attributes.- VRNS has a Quality Grade of B, ranking ahead of 76.06% of graded US stocks.
- VRNS's asset turnover comes in at 0.39 -- ranking 378th of 563 Business Services stocks.
- MANH, GRPN, and HGBL are the stocks whose asset turnover ratios are most correlated with VRNS.
The table below shows VRNS's key quality metrics over time.
Period | Asset Turnover | Gross Margin | ROIC |
---|---|---|---|
2021-09-30 | 0.390 | 0.848 | -0.254 |
2021-06-30 | 0.429 | 0.847 | -0.239 |
2021-03-31 | 0.483 | 0.848 | -0.212 |
2020-12-31 | 0.635 | 0.849 | -0.247 |
2020-09-30 | 0.673 | 0.847 | -0.329 |
2020-06-30 | 0.739 | 0.850 | -0.414 |
VRNS Price Target
For more insight on analysts targets of VRNS, see our VRNS price target page. And for a list of of all stocks sorted by upside potential based on analyst target price, see our Top Price Target page.
Average Price Target | $73.53 | Average Broker Recommendation | 1.48 (Moderate Buy) |
Varonis Systems, Inc. (VRNS) Company Bio
Varonis Systems provides software platform for enterprises to map, analyze, manage, and migrate their unstructured data. The Company specializes in human-generated data, a type of unstructured data that includes an enterprise's spreadsheets, word processing documents, presentations, audio files, video files, emails, text messages and any other data created by employees. The company was founded in 2004 and is based in New York, New York.
Latest VRNS News From Around the Web
Below are the latest news stories about VARONIS SYSTEMS INC that investors may wish to consider to help them evaluate VRNS as an investment opportunity.
There's Reason For Concern Over Varonis Systems, Inc.'s (NASDAQ:VRNS) PriceYou may think that with a price-to-sales (or "P/S") ratio of 5.3x Varonis Systems, Inc. ( NASDAQ:VRNS ) is a stock to... |
Varonis to Present at Upcoming Investor ConferencesNEW YORK, May 10, 2023 (GLOBE NEWSWIRE) -- Varonis Systems, Inc. (Nasdaq: VRNS), a leader in data security, announced its participation at the following upcoming conferences: The 18th Annual Needham Technology & Media Conference, May 16 – 18, in New York. The presentation is scheduled for May 16 at 9:30 a.m. ET.The J.P. Morgan 51st Annual Global Technology, Media and Communications Conference, May 22 – 24, in Boston. The presentation is scheduled for May 22 at 2:30 p.m. ET.The TD Cowen 51st Annu |
Varonis Systems (VRNS) Q1 2023 Earnings Call TranscriptIt is now my pleasure to introduce your host, Tim Perz, director of investor relations. With me on the call today are Yaki Faitelson, chief executive officer; and Guy Melamed, chief financial officer and chief operating officer of Varonis. |
Varonis Systems (VRNS) Reports Break-Even Earnings for Q1Varonis (VRNS) delivered earnings and revenue surprises of 100% and 0.07%, respectively, for the quarter ended March 2023. Do the numbers hold clues to what lies ahead for the stock? |
Varonis: Q1 Earnings SnapshotNEW YORK (AP) — Varonis Systems Inc. (VRNS) on Monday reported a loss of $38.3 million in its first quarter. The average estimate of seven analysts surveyed by Zacks Investment Research was for a loss of 5 cents per share. The data-management software company posted revenue of $107.3 million in the period, which met Street forecasts. |
VRNS Price Returns
1-mo | 10.75% |
3-mo | -5.28% |
6-mo | 20.76% |
1-year | -24.71% |
3-year | -8.82% |
5-year | -0.39% |
YTD | 7.14% |
2022 | -50.92% |
2021 | -10.56% |
2020 | 110.54% |
2019 | 46.90% |
2018 | 8.96% |
Continue Researching VRNS
Here are a few links from around the web to help you further your research on Varonis Systems Inc's stock as an investment opportunity:Varonis Systems Inc (VRNS) Stock Price | Nasdaq
Varonis Systems Inc (VRNS) Stock Quote, History and News - Yahoo Finance
Varonis Systems Inc (VRNS) Stock Price and Basic Information | MarketWatch
Loading social stream, please wait...