Verra Mobility Corporation (VRRM): Price and Financial Metrics
VRRM Price/Volume Stats
Current price | $25.09 | 52-week high | $25.57 |
Prev. close | $25.16 | 52-week low | $16.22 |
Day low | $24.92 | Volume | 351,907 |
Day high | $25.52 | Avg. volume | 1,104,730 |
50-day MA | $22.98 | Dividend yield | N/A |
200-day MA | $20.75 | Market Cap | 4.17B |
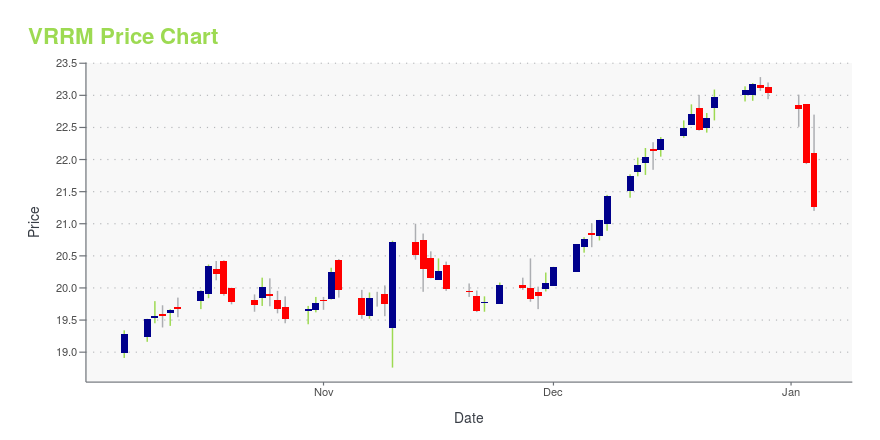
VRRM Stock Price Chart Interactive Chart >
VRRM POWR Grades
- Quality is the dimension where VRRM ranks best; there it ranks ahead of 86.94% of US stocks.
- VRRM's strongest trending metric is Growth; it's been moving down over the last 26 weeks.
- VRRM ranks lowest in Value; there it ranks in the 14th percentile.
VRRM Stock Summary
- VRRM's one year PEG ratio, measuring expected growth in earnings next year relative to current common stock price is 316.84 -- higher than 89.59% of US-listed equities with positive expected earnings growth.
- VRRM's current price/earnings ratio is 44.38, which is higher than 84.01% of US stocks with positive earnings.
- Of note is the ratio of VERRA MOBILITY CORP's sales and general administrative expense to its total operating expenses; only 13.36% of US stocks have a lower such ratio.
- Stocks that are quantitatively similar to VRRM, based on their financial statements, market capitalization, and price volatility, are APLE, SXC, CPA, CRC, and CEIX.
- VRRM's SEC filings can be seen here. And to visit VERRA MOBILITY CORP's official web site, go to www.verramobility.com.
VRRM Valuation Summary
- In comparison to the median Industrials stock, VRRM's EV/EBIT ratio is 32.76% higher, now standing at 23.1.
- Over the past 85 months, VRRM's EV/EBIT ratio has gone up 11745.1.
Below are key valuation metrics over time for VRRM.
Stock | Date | P/S | P/B | P/E | EV/EBIT |
---|---|---|---|---|---|
VRRM | 2023-12-29 | 4.8 | 9.5 | 46.6 | 23.1 |
VRRM | 2023-12-28 | 4.9 | 9.5 | 46.8 | 23.2 |
VRRM | 2023-12-27 | 4.9 | 9.5 | 46.9 | 23.2 |
VRRM | 2023-12-26 | 4.8 | 9.5 | 46.7 | 23.1 |
VRRM | 2023-12-22 | 4.8 | 9.5 | 46.5 | 23.0 |
VRRM | 2023-12-21 | 4.8 | 9.3 | 45.8 | 22.8 |
VRRM Growth Metrics
- The 4 year net cashflow from operations growth rate now stands at 64874.32%.
- Its year over year cash and equivalents growth rate is now at -61.11%.
- Its 3 year cash and equivalents growth rate is now at 4.51%.
The table below shows VRRM's growth in key financial areas (numbers in millions of US dollars).
Date | Revenue | Operating Cash Flow | Net Income to Common Stock |
---|---|---|---|
2022-09-30 | 725.508 | 212.663 | 83.323 |
2022-06-30 | 689.947 | 252.068 | 86.053 |
2022-03-31 | 631.117 | 215.405 | 60.404 |
2021-12-31 | 550.59 | 193.171 | 41.449 |
2021-09-30 | 480.773 | 131.843 | 19.834 |
2021-06-30 | 415.586 | 61.844 | -0.786 |
VRRM's Quality Factors
The “Quality” component of the POWR Ratings focuses on 31 different factors of a companies fundamentals and operational strength. Here are some key insights as we drill into the specifics of these quality attributes.- VRRM has a Quality Grade of C, ranking ahead of 68.43% of graded US stocks.
- VRRM's asset turnover comes in at 0.326 -- ranking 64th of 137 Transportation stocks.
- ATSG, BPMP, and RLGT are the stocks whose asset turnover ratios are most correlated with VRRM.
The table below shows VRRM's key quality metrics over time.
Period | Asset Turnover | Gross Margin | ROIC |
---|---|---|---|
2021-09-30 | 0.326 | 0.949 | 0.065 |
2021-06-30 | 0.287 | 0.947 | 0.042 |
2021-03-31 | 0.262 | 0.933 | 0.015 |
2020-12-31 | 0.288 | 0.915 | 0.039 |
2020-09-30 | 0.295 | 0.920 | 0.056 |
2020-06-30 | 0.317 | 0.924 | 0.075 |
VRRM Price Target
For more insight on analysts targets of VRRM, see our VRRM price target page. And for a list of of all stocks sorted by upside potential based on analyst target price, see our Top Price Target page.
Average Price Target | $17.57 | Average Broker Recommendation | 1.31 (Strong Buy) |
Verra Mobility Corporation (VRRM) Company Bio
Verra Mobility Corporation designs and develops mobility software. The Company offers speed, bus lane, railroad crossing, and school bus top arm enforcement and enforcement ticketing, as well as crash reports and video-enabled crime data analysis solutions. Verra Mobility serves customers worldwide.
Latest VRRM News From Around the Web
Below are the latest news stories about VERRA MOBILITY CORP that investors may wish to consider to help them evaluate VRRM as an investment opportunity.
Chart Of The Day: Verra Mobility Provides Smart Mobility Technology SolutionsVerra Mobility Corporation provides smart mobility technology solutions and services in the United States, Australia, Canada, and Europe. |
Estimating The Fair Value Of Verra Mobility Corporation (NASDAQ:VRRM)Key Insights Using the 2 Stage Free Cash Flow to Equity, Verra Mobility fair value estimate is US$25.09 With US$20.82... |
Thanksgiving weekend traffic data shows red-light running is most prevalent on WednesdaysVerra Mobility Corporation (NASDAQ: VRRM), a leading provider of smart mobility technology solutions, released data from its proprietary U.S. traffic safety systems showing the most red-light violations during the holiday weekend occurred on the Wednesday before Thanksgiving, while the most speeding violations occurred on Thanksgiving Day. |
Verra Mobility to Participate at the UBS Global Technology ConferenceVerra Mobility Corporation (NASDAQ: VRRM), a leading provider of smart mobility technology solutions, announced today that David Roberts, President and Chief Executive Officer and Craig Conti, Chief Financial Officer, are scheduled to participate in a fireside chat at the UBS Global Technology Conference on Tuesday, November 28, 2023 at 10:15am MT (12:15pm ET). The Company's presentation will be posted on the Company's investor relations website at ir.verramobility.com on the morning of the sche |
Should You Be Excited About Verra Mobility Corporation's (NASDAQ:VRRM) 20% Return On Equity?One of the best investments we can make is in our own knowledge and skill set. With that in mind, this article will... |
VRRM Price Returns
1-mo | 16.43% |
3-mo | 8.94% |
6-mo | 34.17% |
1-year | 49.61% |
3-year | 80.50% |
5-year | 110.84% |
YTD | 8.94% |
2023 | 66.52% |
2022 | -10.37% |
2021 | 14.98% |
2020 | -4.07% |
2019 | 43.34% |
Continue Researching VRRM
Want to do more research on VERRA MOBILITY Corp's stock and its price? Try the links below:VERRA MOBILITY Corp (VRRM) Stock Price | Nasdaq
VERRA MOBILITY Corp (VRRM) Stock Quote, History and News - Yahoo Finance
VERRA MOBILITY Corp (VRRM) Stock Price and Basic Information | MarketWatch
Loading social stream, please wait...