
Verisk Analytics Inc. (VRSK): Price and Financial Metrics
VRSK Price/Volume Stats
| Current price | $279.97 | 52-week high | $282.21 |
| Prev. close | $275.90 | 52-week low | $215.32 |
| Day low | $271.70 | Volume | 869,870 |
| Day high | $280.61 | Avg. volume | 841,208 |
| 50-day MA | $266.07 | Dividend yield | 0.56% |
| 200-day MA | $244.00 | Market Cap | 39.94B |
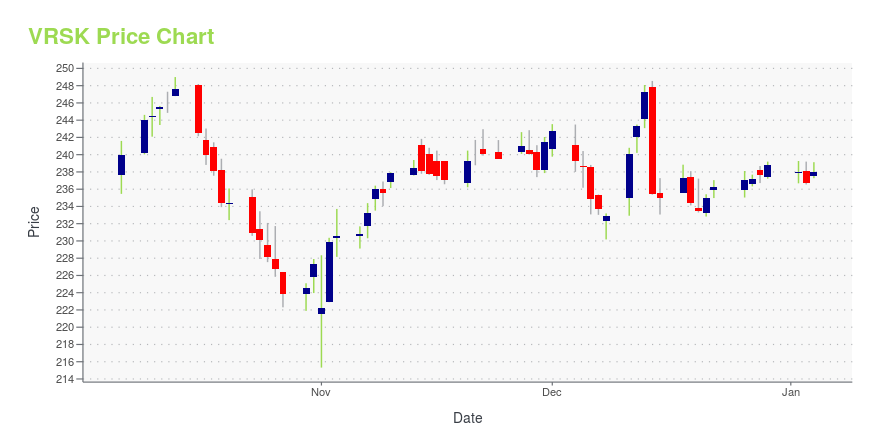
VRSK Stock Price Chart Interactive Chart >
Verisk Analytics Inc. (VRSK) Company Bio
Verisk Analytics, Inc. is an American multinational data analytics and risk assessment firm based in Jersey City, New Jersey, with customers in insurance, natural resources, financial services, government, and risk management sectors. The company uses proprietary data sets and industry expertise to provide predictive analytics and decision support consultations in areas including fraud prevention, actuarial science, insurance coverage, fire protection, catastrophe and weather risk, and data management. (Source:Wikipedia)
Latest VRSK News From Around the Web
Below are the latest news stories about VERISK ANALYTICS INC that investors may wish to consider to help them evaluate VRSK as an investment opportunity.
The 500 Top Stocks to Buy for 2024, Ranked by AIThese are the very best stocks to buy for 2024 for any investor, according to Tom Yeung's MarketMasterAI system. |
Paychex (PAYX) Q2 Earnings Beat on Solid Segmental PerformancePaychex (PAYX) benefits from record-level client retention and a strong pipeline for its services. |
Verisk Ranks No. 4 on Investor’s Business Daily’s 100 Best ESG Companies ListIBD list recognizes companies with superior environmental, social and governance ratings and strong stock performanceJERSEY CITY, N.J., Dec. 19, 2023 (GLOBE NEWSWIRE) -- Verisk (Nasdaq: VRSK), a leading global data analytics and technology provider, has ranked fourth out of the 100 Best ESG Companies in 2023 by Investor’s Business Daily. The fifth annual list recognizes companies with superior environmental, social and governance (ESG) ratings as well as fundamental and technical stock performan |
Verisk Analytics (VRSK) Rose on Broad-Based Revenue UpsideTimesSquare Capital Management, an equity investment management company, released its “U.S. Mid Cap Growth Strategy” third-quarter investor letter. A copy of the same can be downloaded here. In the third quarter, the strategy outperformed the Russell Midcap Growth Index and returned -4.11% (net) while the index return was -5.22%. The third quarter saw a decline in […] |
Zacks Industry Outlook Highlights S&P Global Verisk Analytics, Inc. and Dun & Bradstreet HoldingsS&P Global, Verisk Analytics, Inc. and Dun & Bradstreet Holdings are part of the Zacks Industry Outlook article. |
VRSK Price Returns
| 1-mo | 3.75% |
| 3-mo | 26.79% |
| 6-mo | 15.03% |
| 1-year | 21.67% |
| 3-year | 52.83% |
| 5-year | 89.54% |
| YTD | 17.58% |
| 2023 | 36.24% |
| 2022 | -22.33% |
| 2021 | 10.85% |
| 2020 | 39.89% |
| 2019 | 37.92% |
VRSK Dividends
| Ex-Dividend Date | Type | Payout Amount | Change | ||||||
|---|---|---|---|---|---|---|---|---|---|
| Loading, please wait... | |||||||||
Continue Researching VRSK
Want to see what other sources are saying about Verisk Analytics Inc's financials and stock price? Try the links below:Verisk Analytics Inc (VRSK) Stock Price | Nasdaq
Verisk Analytics Inc (VRSK) Stock Quote, History and News - Yahoo Finance
Verisk Analytics Inc (VRSK) Stock Price and Basic Information | MarketWatch
Loading social stream, please wait...