
Vertiv Holdings LLC (VRT): Price and Financial Metrics
VRT Price/Volume Stats
| Current price | $77.12 | 52-week high | $109.27 |
| Prev. close | $76.48 | 52-week low | $25.09 |
| Day low | $76.82 | Volume | 7,833,734 |
| Day high | $80.50 | Avg. volume | 8,628,072 |
| 50-day MA | $91.98 | Dividend yield | 0.11% |
| 200-day MA | $68.40 | Market Cap | 28.87B |
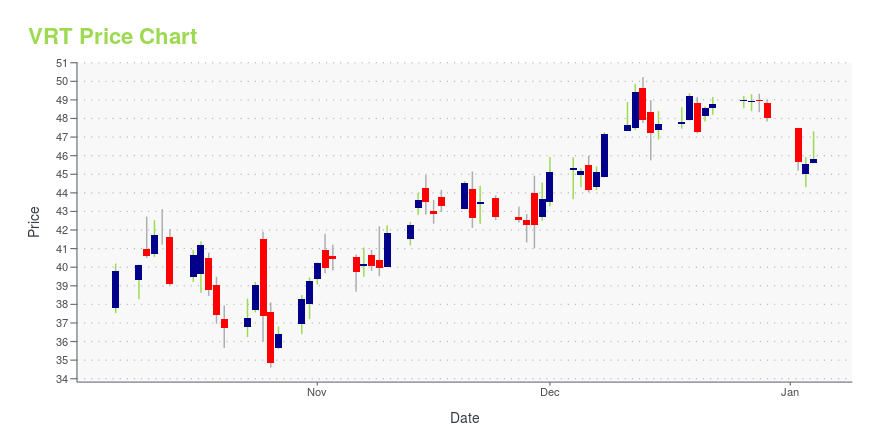
VRT Stock Price Chart Interactive Chart >
Vertiv Holdings LLC (VRT) Company Bio
Vertiv Holdings Co. designs, manufactures, and services digital infrastructure technology for electronics that process, store, and transmit data. The company operates in three segments: Americas, Asia Pacific, and EMEA. It offers power management products, thermal management products, integrated rack systems, modular solutions, and management systems for monitoring and controlling digital infrastructure. These offerings are integral to the technologies used for various services, including e-commerce, online banking, file sharing, video on-demand, energy storage, wireless communications, Internet of Things, and online gaming. The company, through its global services network, also provides lifecycle management services, predictive analytics, and professional services for deploying, maintaining, and optimizing these products and their related systems. It serves customers in various end markets, including data centers, communication networks, and commercial and industrial environments worldwide.
Latest VRT News From Around the Web
Below are the latest news stories about VERTIV HOLDINGS CO that investors may wish to consider to help them evaluate VRT as an investment opportunity.
VRT or NOW: Which Is the Better Value Stock Right Now?VRT vs. NOW: Which Stock Is the Better Value Option? |
Micron (MU) & Fujian Jinhua Reach IP Theft Lawsuit SettlementMicron Technology (MU) navigates geopolitical tensions, settles IP theft suit with Fujian Jinhua amid China's chip restrictions, reshaping semiconductor dynamics. |
Here is Why Growth Investors Should Buy Vertiv Holdings Co. (VRT) NowVertiv Holdings Co. (VRT) could produce exceptional returns because of its solid growth attributes. |
Asure Software (ASUR) Enhances Payroll With SAP IntegrationAsure's (ASUR) integration into SAP PartnerEdge Open Ecosystem fuels HCM innovation, enhancing payroll tax efficiency for SAP clients. |
Weave (WEAV) Boosts Portfolio Strength With New ReleasesWeave (WEAV) advances healthcare with Digital Forms enhancements, empowering efficiency and elevating patient engagement. |
VRT Price Returns
| 1-mo | -11.37% |
| 3-mo | -17.51% |
| 6-mo | 44.31% |
| 1-year | 204.85% |
| 3-year | 179.28% |
| 5-year | 655.80% |
| YTD | 60.62% |
| 2023 | 251.81% |
| 2022 | -45.25% |
| 2021 | 33.80% |
| 2020 | 69.36% |
| 2019 | 12.55% |
VRT Dividends
| Ex-Dividend Date | Type | Payout Amount | Change | ||||||
|---|---|---|---|---|---|---|---|---|---|
| Loading, please wait... | |||||||||
Loading social stream, please wait...