Virtus Investment Partners, Inc. (VRTS): Price and Financial Metrics
VRTS Price/Volume Stats
Current price | $201.65 | 52-week high | $248.23 |
Prev. close | $203.36 | 52-week low | $141.80 |
Day low | $199.00 | Volume | 39,500 |
Day high | $204.43 | Avg. volume | 57,446 |
50-day MA | $204.78 | Dividend yield | 3.22% |
200-day MA | $197.49 | Market Cap | 1.46B |
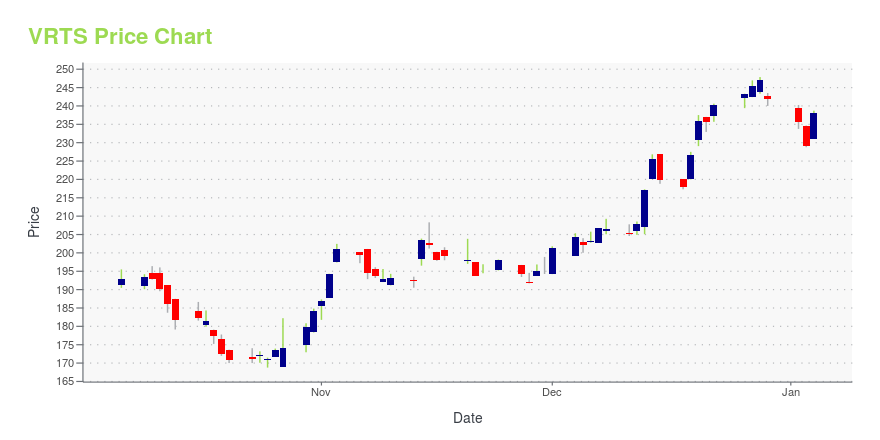
VRTS Stock Price Chart Interactive Chart >
VRTS POWR Grades
- Momentum is the dimension where VRTS ranks best; there it ranks ahead of 89.64% of US stocks.
- The strongest trend for VRTS is in Stability, which has been heading up over the past 179 days.
- VRTS's current lowest rank is in the Sentiment metric (where it is better than 21.33% of US stocks).
VRTS Stock Summary
- With a one year PEG ratio of 257.8, VIRTUS INVESTMENT PARTNERS INC is expected to have a higher PEG ratio (a measure of how expensive a stock is relative to its expected earnings growth) than 88.56% of US stocks.
- As for revenue growth, note that VRTS's revenue has grown -17.67% over the past 12 months; that beats the revenue growth of merely 13.98% of US companies in our set.
- In terms of volatility of its share price, VRTS is more volatile than only 21.58% of stocks we're observing.
- Stocks that are quantitatively similar to VRTS, based on their financial statements, market capitalization, and price volatility, are DAN, ACEL, DNUT, BALY, and HRT.
- VRTS's SEC filings can be seen here. And to visit VIRTUS INVESTMENT PARTNERS INC's official web site, go to www.virtus.com.
VRTS Valuation Summary
- VRTS's EV/EBIT ratio is 10.3; this is 8.85% lower than that of the median Financial Services stock.
- VRTS's price/sales ratio has moved up 1.5 over the prior 179 months.
Below are key valuation metrics over time for VRTS.
Stock | Date | P/S | P/B | P/E | EV/EBIT |
---|---|---|---|---|---|
VRTS | 2023-09-15 | 1.8 | 1.8 | 11.0 | 10.3 |
VRTS | 2023-09-14 | 1.8 | 1.8 | 11.0 | 10.2 |
VRTS | 2023-09-13 | 1.8 | 1.7 | 10.8 | 10.1 |
VRTS | 2023-09-12 | 1.8 | 1.7 | 10.8 | 10.1 |
VRTS | 2023-09-11 | 1.8 | 1.7 | 10.7 | 10.1 |
VRTS | 2023-09-08 | 1.8 | 1.7 | 10.7 | 10.1 |
VRTS Growth Metrics
- Its year over year price growth rate is now at -38.08%.
- The 3 year net cashflow from operations growth rate now stands at 1906.38%.
- Its 4 year net income to common stockholders growth rate is now at 34.58%.

The table below shows VRTS's growth in key financial areas (numbers in millions of US dollars).
Date | Revenue | Operating Cash Flow | Net Income to Common Stock |
---|---|---|---|
2022-12-31 | 886.379 | 132.67 | 117.541 |
2022-09-30 | 954.27 | 396.9 | 131.981 |
2022-06-30 | 996.073 | 464.16 | 159.037 |
2022-03-31 | 1,014.777 | 433.803 | 204.602 |
2021-12-31 | 979.234 | 665.729 | 208.131 |
2021-09-30 | 884.618 | 577.843 | 201.606 |
VRTS's Quality Factors
The “Quality” component of the POWR Ratings focuses on 31 different factors of a companies fundamentals and operational strength. Here are some key insights as we drill into the specifics of these quality attributes.- VRTS has a Quality Grade of C, ranking ahead of 46.14% of graded US stocks.
- VRTS's asset turnover comes in at 0.221 -- ranking 88th of 444 Trading stocks.
- LSI, SUI, and APAM are the stocks whose asset turnover ratios are most correlated with VRTS.
The table below shows VRTS's key quality metrics over time.
Period | Asset Turnover | Gross Margin | ROIC |
---|---|---|---|
2021-06-30 | 0.221 | 1 | 0.062 |
2021-03-31 | 0.195 | 1 | 0.052 |
2020-12-31 | 0.178 | 1 | 0.045 |
2020-09-30 | 0.174 | 1 | 0.043 |
2020-06-30 | 0.175 | 1 | 0.044 |
2020-03-31 | 0.181 | 1 | 0.050 |
VRTS Price Target
For more insight on analysts targets of VRTS, see our VRTS price target page. And for a list of of all stocks sorted by upside potential based on analyst target price, see our Top Price Target page.
Average Price Target | $400.00 | Average Broker Recommendation | 1.5 (Moderate Buy) |
Virtus Investment Partners, Inc. (VRTS) Company Bio
Virtus Investment Partners provides investment services to individual and institutional clients.The company was founded in 1988 and is based in Hartford, Connecticut.
Latest VRTS News From Around the Web
Below are the latest news stories about VIRTUS INVESTMENT PARTNERS INC that investors may wish to consider to help them evaluate VRTS as an investment opportunity.
Victory Capital (VCTR) August AUM Declines 2.4% to $161.86BVictory Capital (VCTR) witnesses a decline in the August AUM balance from July due to weaker equity market performance. |
Lazard's (LAZ) August AUM Falls 2.9% on Challenging MarketsLazard's (LAZ) August AUM declines 2.9% to $237.3 billion due to a challenging market backdrop. |
T. Rowe Price's (TROW) August AUM Declines 2.2% on Weak MarketsT. Rowe Price's (TROW) August AUM decreases 2.2% to $1.40 trillion due to unfavorable market conditions. |
Virtus Investment (VRTS) August AUM Down on Unfavorable MarketsVirtus Investment (VRTS) reports a 1.5% decline in August AUM, majorly attributable to a fall in open-end & closed-end funds. |
Franklin's (BEN) August AUM Falls 1.9% on Unfavorable MarketsFranklin's (BEN) August AUM balance declines on the back of unfavorable market performance and modest long-term net outflows. |
VRTS Price Returns
1-mo | 0.49% |
3-mo | 3.29% |
6-mo | 21.93% |
1-year | 18.32% |
3-year | 60.02% |
5-year | 87.26% |
YTD | 7.99% |
2022 | -33.50% |
2021 | 38.98% |
2020 | 82.52% |
2019 | 56.62% |
2018 | -29.81% |
VRTS Dividends
Ex-Dividend Date | Type | Payout Amount | Change | ||||||
---|---|---|---|---|---|---|---|---|---|
Loading, please wait... |
Continue Researching VRTS
Here are a few links from around the web to help you further your research on Virtus Investment Partners Inc's stock as an investment opportunity:Virtus Investment Partners Inc (VRTS) Stock Price | Nasdaq
Virtus Investment Partners Inc (VRTS) Stock Quote, History and News - Yahoo Finance
Virtus Investment Partners Inc (VRTS) Stock Price and Basic Information | MarketWatch
Loading social stream, please wait...