
Vertex Pharmaceuticals Inc. (VRTX): Price and Financial Metrics
VRTX Price/Volume Stats
| Current price | $495.26 | 52-week high | $503.99 |
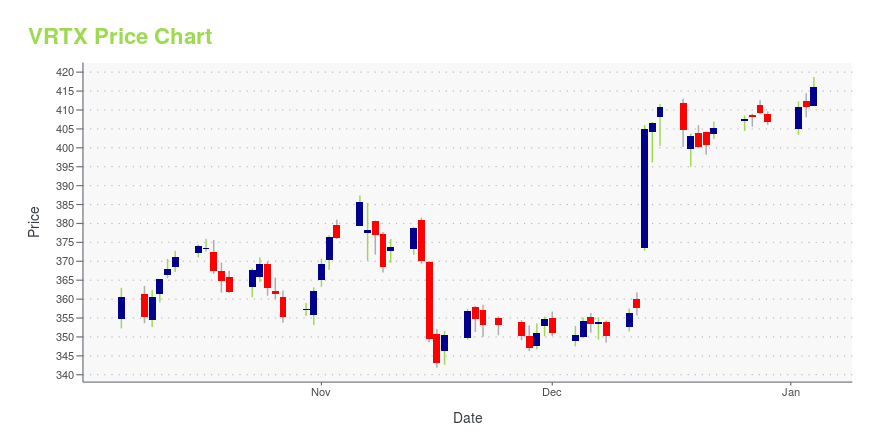
| Prev. close | $492.26 | 52-week low | $340.20 |
| Day low | $492.17 | Volume | 773,867 |
| Day high | $502.97 | Avg. volume | 1,207,826 |
| 50-day MA | $472.75 | Dividend yield | N/A |
| 200-day MA | $417.66 | Market Cap | 127.80B |
VRTX Stock Price Chart Interactive Chart >
Vertex Pharmaceuticals Inc. (VRTX) Company Bio
Vertex Pharmaceuticals, Inc. is an American biopharmaceutical company based in Boston, Massachusetts. It was one of the first biotech firms to use an explicit strategy of rational drug design rather than combinatorial chemistry. It maintains headquarters in South Boston, Massachusetts, and three research facilities, in San Diego, California, and Milton Park, near Oxford, England. (Source:Wikipedia)
Latest VRTX News From Around the Web
Below are the latest news stories about VERTEX PHARMACEUTICALS INC that investors may wish to consider to help them evaluate VRTX as an investment opportunity.
3 Reasons to Buy Vertex Pharmaceuticals Stock Like There's No TomorrowWith a new medicine on the market and plenty of money, Vertex is in great shape. |
3 Monster Stocks to Buy Without Any HesitationThese are easy choices for investors seeking market-beating long-term gains. |
Should You Invest in Bluebird Bio Right Now?After two December share price crashes, there's no evident cure for Bluebird Bio's ills. |
3 Top Stocks to Buy Hand Over Fist Before the End of 2023These are ideal stocks to buy sooner rather than later. |
Editas Just Caught a Break Thanks to Vertex PharmaceuticalsEditas isn't out of the woods yet, but it's better off than before. |
VRTX Price Returns
| 1-mo | 4.49% |
| 3-mo | 24.60% |
| 6-mo | 15.13% |
| 1-year | 41.65% |
| 3-year | 144.15% |
| 5-year | 196.87% |
| YTD | 21.72% |
| 2023 | 40.90% |
| 2022 | 31.50% |
| 2021 | -7.08% |
| 2020 | 7.94% |
| 2019 | 32.13% |
Continue Researching VRTX
Want to see what other sources are saying about Vertex Pharmaceuticals Inc's financials and stock price? Try the links below:Vertex Pharmaceuticals Inc (VRTX) Stock Price | Nasdaq
Vertex Pharmaceuticals Inc (VRTX) Stock Quote, History and News - Yahoo Finance
Vertex Pharmaceuticals Inc (VRTX) Stock Price and Basic Information | MarketWatch
Loading social stream, please wait...