
VistaGen Therapeutics, Inc. (VTGN): Price and Financial Metrics
VTGN Price/Volume Stats
| Current price | $3.68 | 52-week high | $24.71 |
| Prev. close | $3.64 | 52-week low | $1.63 |
| Day low | $3.61 | Volume | 64,207 |
| Day high | $3.75 | Avg. volume | 211,456 |
| 50-day MA | $3.76 | Dividend yield | N/A |
| 200-day MA | $4.26 | Market Cap | 99.45M |
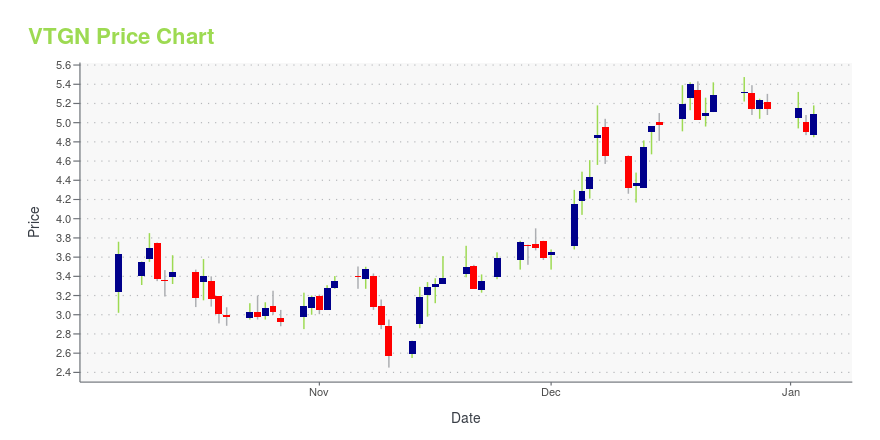
VTGN Stock Price Chart Interactive Chart >
VistaGen Therapeutics, Inc. (VTGN) Company Bio
VistaGen Therapeutics, Inc. operates as a clinical-stage biopharmaceutical company. The Company develops products for patients with diseases and disorders involving the central nervous system. VistaGen Therapeutics serves customers in the United States.
Latest VTGN News From Around the Web
Below are the latest news stories about VISTAGEN THERAPEUTICS INC that investors may wish to consider to help them evaluate VTGN as an investment opportunity.
Vistagen Receives Notice from European Patent Office of Intention to Grant Patent for AV-101 to Treat Neuropathic PainSOUTH SAN FRANCISCO, Calif., December 27, 2023--Vistagen (Nasdaq: VTGN), a late clinical-stage biopharmaceutical company aiming to transform the treatment landscape for individuals living with anxiety, depression, and other central nervous system (CNS) disorders, today announced that the European Patent Office (EPO) issued a Notice of Intention to Grant a patent related to the use of AV-101 for the treatment of neuropathic pain. AV-101 is the Company’s investigational oral prodrug of 7-chloro-ky |
11 Most Promising Psychedelic Stocks According to Hedge FundsIn this piece, we will take a look at the 11 most promising psychedelic stocks according to hedge funds. If you want to skip our overview of the psychedelic industry and the latest news, then you can take a look at the 5 Most Promising Psychedelic Stocks. The ability to use chemicals to alter one’s […] |
Retail investors are Vistagen Therapeutics, Inc.'s (NASDAQ:VTGN) biggest owners and were rewarded after market cap rose by US$12m last weekKey Insights Significant control over Vistagen Therapeutics by retail investors implies that the general public has... |
VistaGen Therapeutics, Inc. (NASDAQ:VTGN) Q2 2024 Earnings Call TranscriptVistaGen Therapeutics, Inc. (NASDAQ:VTGN) Q2 2024 Earnings Call Transcript November 10, 2023 Operator: Good day, everyone and welcome to today’s Vistagen Fiscal Year 2024 Second Quarter Corporate Update Conference Call. [Operator Instructions] Please note this call is being recorded. I will be standing by if you should need any assistance. It is now my pleasure […] |
Vistagen Provides Corporate Update and Reports Fiscal 2024 Second Quarter Financial ResultsSOUTH SAN FRANCISCO, Calif., November 09, 2023--Vistagen (Nasdaq: VTGN), a late clinical-stage biopharmaceutical company aiming to transform the treatment landscape for individuals living with anxiety, depression, and other central nervous system (CNS) disorders, today provided a corporate update and reported financial results for its fiscal year 2024 second quarter ended September 30, 2023. |
VTGN Price Returns
| 1-mo | 13.23% |
| 3-mo | -22.53% |
| 6-mo | -24.12% |
| 1-year | 119.05% |
| 3-year | -95.52% |
| 5-year | -75.95% |
| YTD | -28.40% |
| 2023 | 66.34% |
| 2022 | -94.72% |
| 2021 | 0.52% |
| 2020 | 181.28% |
| 2019 | -54.02% |
Loading social stream, please wait...