Vuzix Corporation (VUZI): Price and Financial Metrics
VUZI Price/Volume Stats
Current price | $2.23 | 52-week high | $6.06 |
Prev. close | $2.16 | 52-week low | $1.87 |
Day low | $2.23 | Volume | 2,453 |
Day high | $2.23 | Avg. volume | 750,123 |
50-day MA | $2.94 | Dividend yield | N/A |
200-day MA | $4.01 | Market Cap | 141.22M |
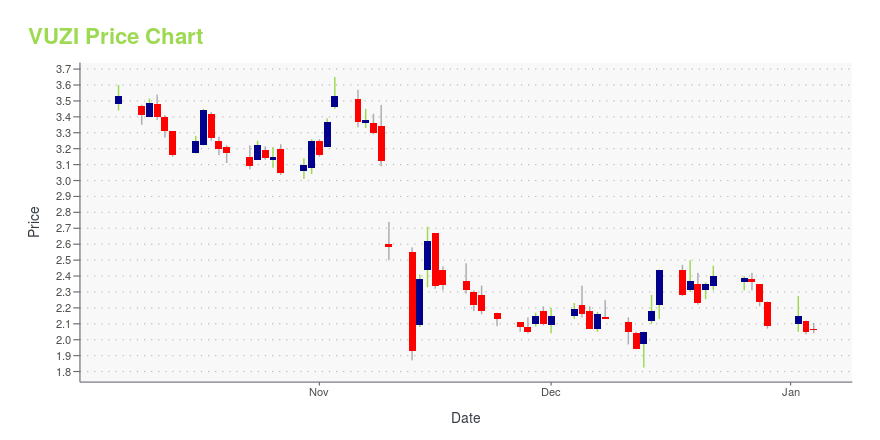
VUZI Stock Price Chart Interactive Chart >
VUZI POWR Grades
- VUZI scores best on the Growth dimension, with a Growth rank ahead of 15.61% of US stocks.
- VUZI's strongest trending metric is Value; it's been moving up over the last 177 days.
- VUZI's current lowest rank is in the Sentiment metric (where it is better than 1.09% of US stocks).
VUZI Stock Summary
- For VUZI, its debt to operating expenses ratio is greater than that reported by only 5.05% of US equities we're observing.
- VUZI's equity multiplier -- a measure of assets relative to shareholders'equity -- is greater than that of merely 9.26% of US stocks.
- With a year-over-year growth in debt of -34.33%, VUZIX CORP's debt growth rate surpasses only 9.35% of about US stocks.
- If you're looking for stocks that are quantitatively similar to VUZIX CORP, a group of peers worth examining would be STXS, AMPL, S, OKTA, and BILL.
- VUZI's SEC filings can be seen here. And to visit VUZIX CORP's official web site, go to www.vuzix.com.
VUZI Valuation Summary
- VUZI's EV/EBIT ratio is -2.3; this is 111.08% lower than that of the median Technology stock.
- VUZI's EV/EBIT ratio has moved up 8 over the prior 166 months.
Below are key valuation metrics over time for VUZI.
Stock | Date | P/S | P/B | P/E | EV/EBIT |
---|---|---|---|---|---|
VUZI | 2023-11-28 | 9.3 | 1.4 | -3.2 | -2.3 |
VUZI | 2023-11-27 | 9.4 | 1.4 | -3.2 | -2.3 |
VUZI | 2023-11-24 | 9.7 | 1.4 | -3.3 | -2.4 |
VUZI | 2023-11-22 | 9.9 | 1.4 | -3.4 | -2.5 |
VUZI | 2023-11-21 | 10.1 | 1.5 | -3.4 | -2.5 |
VUZI | 2023-11-20 | 10.5 | 1.5 | -3.6 | -2.7 |
VUZI Growth Metrics
- Its 3 year cash and equivalents growth rate is now at 1023.65%.
- Its 3 year revenue growth rate is now at 48.32%.
- Its 4 year price growth rate is now at -51.86%.

The table below shows VUZI's growth in key financial areas (numbers in millions of US dollars).
Date | Revenue | Operating Cash Flow | Net Income to Common Stock |
---|---|---|---|
2022-09-30 | 12.25186 | -26.00636 | -47.01694 |
2022-06-30 | 11.84381 | -24.88862 | -45.48601 |
2022-03-31 | 11.75259 | -27.49386 | -44.2438 |
2021-12-31 | 13.16493 | -26.98041 | -40.37716 |
2021-09-30 | 14.08492 | -21.6136 | -27.48439 |
2021-06-30 | 13.84486 | -18.20168 | -24.8197 |
VUZI's Quality Factors
The “Quality” component of the POWR Ratings focuses on 31 different factors of a companies fundamentals and operational strength. Here are some key insights as we drill into the specifics of these quality attributes.- VUZI has a Quality Grade of F, ranking ahead of 1.58% of graded US stocks.
- VUZI's asset turnover comes in at 0.137 -- ranking 188th of 208 Electronic Equipment stocks.
- NVEC, INSG, and HLIT are the stocks whose asset turnover ratios are most correlated with VUZI.
The table below shows VUZI's key quality metrics over time.
Period | Asset Turnover | Gross Margin | ROIC |
---|---|---|---|
2021-06-30 | 0.137 | 0.196 | -1.658 |
2021-03-31 | 0.202 | 0.210 | -1.370 |
2020-12-31 | 0.312 | 0.166 | -1.297 |
2020-09-30 | 0.298 | -0.338 | -1.655 |
2020-06-30 | 0.258 | -0.485 | -1.664 |
2020-03-31 | 0.246 | -0.640 | -1.753 |
VUZI Price Target
For more insight on analysts targets of VUZI, see our VUZI price target page. And for a list of of all stocks sorted by upside potential based on analyst target price, see our Top Price Target page.
Average Price Target | $30.00 | Average Broker Recommendation | 1.5 (Moderate Buy) |
Vuzix Corporation (VUZI) Company Bio
Vuzix Corporation designs, manufactures, markets, and sells wearable display devices in the United States and internationally. The company was founded in 1997 and is based in West Henrietta, New York.
Latest VUZI News From Around the Web
Below are the latest news stories about VUZIX CORP that investors may wish to consider to help them evaluate VUZI as an investment opportunity.
Vuzix (VUZI) Unveils Its Latest Ultralite Smart Glass ModelVuzix (VUZI) introduces its latest smart glass model, the Vuzix Ultralite S, featuring Incognito technology, wireless connectivity, waveguide optics and micro-display solutions. |
Vuzix Unveils Sports & Fitness Configuration of Ultralite Smart Glasses Platform with New Award Winning Ultralite SVuzix® Corporation (NASDAQ: VUZI), ("Vuzix" or, the "Company"), a leading supplier of Smart Glasses and Augmented Reality (AR) technology and products, today announced the expansion of its Vuzix Ultralite OEM PlatformSM with its new, award winning Ultralite S AR smart glasses aimed in part at sports and fitness users. |
Vuzix Enters into a Partnership Agreement with Quanta ComputerVuzix® Corporation (NASDAQ: VUZI), ("Vuzix" or, the "Company"), a leading supplier of smart glasses and Augmented Reality (AR) technology and products, and Quanta Computer ("Quanta"), a Global Fortune 500 Company and worldwide leading Original Design Manufacturer (ODM), today announced that the two firms have entered into a partnership agreement which will support the manufacture of next generation lightweight smart glasses for the broader markets. |
Today’s Biggest Pre-Market Stock Movers: 10 Top Gainers and Losers on FridayWe're closing out the trading week with a breakdown of the biggest pre-market stock movers worth watching for Friday morning! |
Vuzix Corporation (NASDAQ:VUZI) Q3 2023 Earnings Call TranscriptVuzix Corporation (NASDAQ:VUZI) Q3 2023 Earnings Call Transcript November 9, 2023 Vuzix Corporation misses on earnings expectations. Reported EPS is $-0.17 EPS, expectations were $-0.14. Operator: Greetings and welcome to the Vuzix Third Quarter Ending September 30th, 2023 Financial Results and Business Update Conference Call. At this time all participants are in a listen-only mode. […] |
VUZI Price Returns
1-mo | -33.73% |
3-mo | -41.62% |
6-mo | -54.40% |
1-year | -46.90% |
3-year | -47.03% |
5-year | -60.46% |
YTD | -38.74% |
2022 | -58.02% |
2021 | -4.52% |
2020 | 351.74% |
2019 | -58.21% |
2018 | -23.04% |
Continue Researching VUZI
Want to do more research on Vuzix Corp's stock and its price? Try the links below:Vuzix Corp (VUZI) Stock Price | Nasdaq
Vuzix Corp (VUZI) Stock Quote, History and News - Yahoo Finance
Vuzix Corp (VUZI) Stock Price and Basic Information | MarketWatch
Loading social stream, please wait...