
Voyager Therapeutics, Inc. (VYGR): Price and Financial Metrics
VYGR Price/Volume Stats
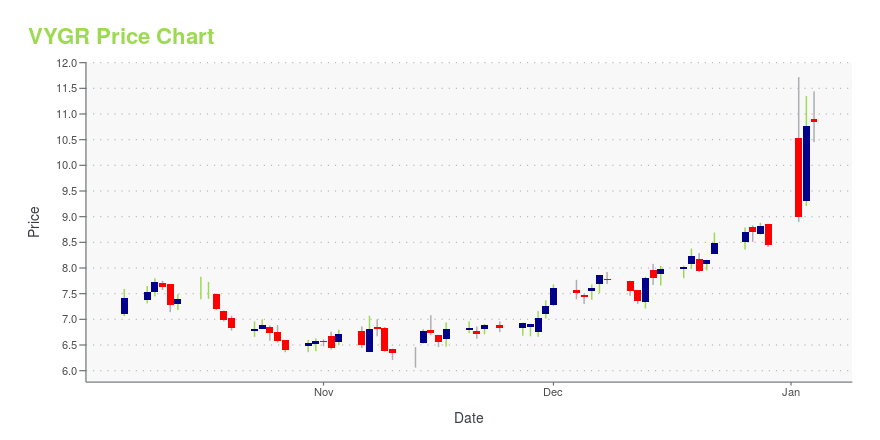
| Current price | $9.27 | 52-week high | $11.72 |
| Prev. close | $9.19 | 52-week low | $6.06 |
| Day low | $9.18 | Volume | 353,236 |
| Day high | $9.48 | Avg. volume | 704,190 |
| 50-day MA | $8.37 | Dividend yield | N/A |
| 200-day MA | $8.09 | Market Cap | 504.23M |
VYGR Stock Price Chart Interactive Chart >
Voyager Therapeutics, Inc. (VYGR) Company Bio
Voyager Therapeutics, Inc., a clinical-stage gene therapy company, focuses on the development of treatments for patients suffering from severe diseases of the central nervous system. The company was founded in 2013 and is based in Cambridge, Massachusetts.
Latest VYGR News From Around the Web
Below are the latest news stories about VOYAGER THERAPEUTICS INC that investors may wish to consider to help them evaluate VYGR as an investment opportunity.
7 Undervalued Biotech Stocks That are Flying Under the Clinical RadarWith so many innovative firms skyrocketing this year, astute investors seeking compelling discounts may want to turn their attention to undervalued biotech picks. |
12 Best Healthcare Stocks For the Long-TermIn this piece, we will take a look at the 12 best healthcare stocks for the long term. If you want to skip our overview of the healthcare industry, then you can take a look at 5 Best Healthcare Stocks For the Long-Term. The healthcare industry is one of the biggest industries in the world. […] |
Voyager Therapeutics Announces Selection of Development Candidate for SOD1 Amyotrophic Lateral Sclerosis Gene Therapy Program- IND filing expected in mid-2025 -LEXINGTON, Mass., Dec. 06, 2023 (GLOBE NEWSWIRE) -- Voyager Therapeutics, Inc. (Nasdaq: VYGR), a biotechnology company dedicated to breaking through barriers in gene therapy and neurology, today announced that it has selected a lead development candidate for its superoxide dismutase 1 (SOD1)-mutated amyotrophic lateral sclerosis (ALS) gene therapy program. The Company anticipates filing an investigational new drug (IND) application with the Food and Drug Admini |
Voyager Therapeutics (NASDAQ:VYGR) shareholders have endured a 43% loss from investing in the stock five years agoFor many, the main point of investing is to generate higher returns than the overall market. But even the best stock... |
Voyager Therapeutics, Inc. (NASDAQ:VYGR) Q3 2023 Earnings Call TranscriptVoyager Therapeutics, Inc. (NASDAQ:VYGR) Q3 2023 Earnings Call Transcript November 6, 2023 Voyager Therapeutics, Inc. misses on earnings expectations. Reported EPS is $-0.59 EPS, expectations were $-0.58. Operator: Good afternoon, and welcome to the Voyager Therapeutics Third Quarter 2023 Conference Call. All participants are now in a listen-only mode. There will be a question-and-answer session […] |
VYGR Price Returns
| 1-mo | 18.85% |
| 3-mo | 21.65% |
| 6-mo | 23.44% |
| 1-year | 6.92% |
| 3-year | 200.97% |
| 5-year | -59.71% |
| YTD | 9.83% |
| 2023 | 38.36% |
| 2022 | 125.09% |
| 2021 | -62.10% |
| 2020 | -48.75% |
| 2019 | 48.40% |
Continue Researching VYGR
Here are a few links from around the web to help you further your research on Voyager Therapeutics Inc's stock as an investment opportunity:Voyager Therapeutics Inc (VYGR) Stock Price | Nasdaq
Voyager Therapeutics Inc (VYGR) Stock Quote, History and News - Yahoo Finance
Voyager Therapeutics Inc (VYGR) Stock Price and Basic Information | MarketWatch
Loading social stream, please wait...