
VYNE Therapeutics Inc. (VYNE): Price and Financial Metrics
VYNE Price/Volume Stats
| Current price | $2.09 | 52-week high | $6.79 |
| Prev. close | $2.10 | 52-week low | $1.57 |
| Day low | $2.01 | Volume | 13,237 |
| Day high | $2.13 | Avg. volume | 90,245 |
| 50-day MA | $2.22 | Dividend yield | N/A |
| 200-day MA | $2.51 | Market Cap | 30.36M |
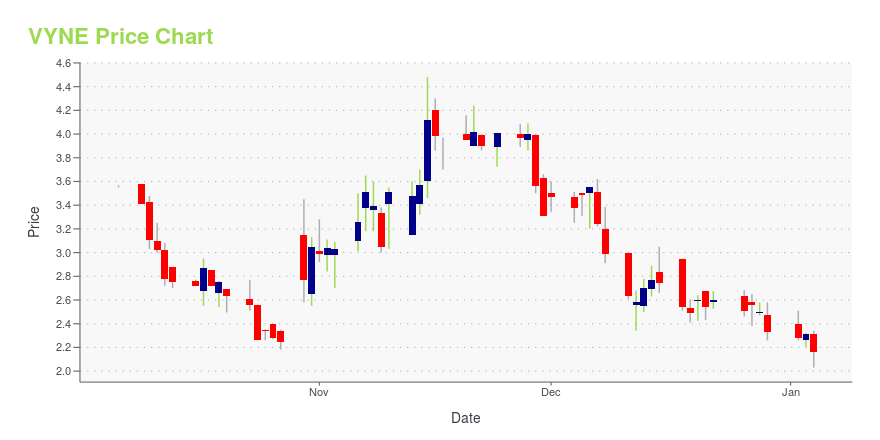
VYNE Stock Price Chart Interactive Chart >
VYNE Therapeutics Inc. (VYNE) Company Bio
VYNE Therapeutics Inc. operates as a clinical stage bio-pharmaceutical company. The Company develops medicines and therapies for the treatment of chronic pruritus and cough. VYNE Therapeutics serves customers worldwide.
Latest VYNE News From Around the Web
Below are the latest news stories about VYNE THERAPEUTICS INC that investors may wish to consider to help them evaluate VYNE as an investment opportunity.
VYNE Therapeutics Reports Third Quarter 2023 Financial Results and Provides Business UpdateTransformative capital raise of $88.2 million from leading healthcare investors provides funding for BET inhibitor programs through the end of 2025 Phase 2b preparatory activities progressing for VYN201 in nonsegmental vitiligo following positive Phase 1b results On track for VYN202 IND submission by year-end 2023, with plans to begin Phase 1a trial in Q1 2024 BRIDGEWATER, N.J., Nov. 13, 2023 (GLOBE NEWSWIRE) -- VYNE Therapeutics Inc. (Nasdaq: VYNE) (“VYNE” or the “Company”), a clinical-stage bi |
VYNE Therapeutics to Host Virtual R&D Day Event on November 9, 2023Event will highlight VYN201 Phase 1b trial results, VYN202 preclinical data and VYNE’s clinical development plans Program to feature KOL presentation covering unmet need and current treatment landscape in vitiligo BRIDGEWATER, N.J., Nov. 07, 2023 (GLOBE NEWSWIRE) -- VYNE Therapeutics Inc. (Nasdaq: VYNE) (“VYNE” or the “Company”), a clinical-stage biopharmaceutical company developing proprietary, innovative and differentiated therapies for the treatment of immuno-inflammatory conditions, today an |
VYNE Therapeutics Announces Closing of Previously Announced Private Placement of $88.2 MillionTransformative capital raise to fund VYNE’s BET inhibitor programs through the end of 2025BRIDGEWATER, N.J., Nov. 01, 2023 (GLOBE NEWSWIRE) -- VYNE Therapeutics Inc. (Nasdaq: VYNE) (“VYNE” or the “Company”), a clinical-stage biopharmaceutical company developing proprietary, innovative and differentiated therapies for the treatment of immuno-inflammatory conditions, today announced the closing of its previously announced private placement financing (the “PIPE”). In the PIPE, VYNE received aggrega |
VYNE Therapeutics Reports Positive Results from Preclinical Models for Oral BD2-Selective BET Inhibitor VYN202Treatment with VYN202 resulted in significant inhibition of key inflammatory biomarkers and substantial resolution of the signs and symptoms of psoriasis and rheumatoid arthritisFollowing completion of recent financing, VYNE expects to initiate a Phase 1a SAD/MAD clinical trial in Q1 2024, followed by Phase 1b trials in moderate-to-severe plaque psoriasis and in moderate-to-severe adult-onset rheumatoid arthritis in the second half of 2024Preclinical data and clinical programs to be discussed at |
VYNE Therapeutics Announces Private Placement of $88 MillionTransaction provides $88 million to fund VYNE’s clinical development programs for VYN201 and VYN202 through the end of 2025BRIDGEWATER, N.J., Oct. 30, 2023 (GLOBE NEWSWIRE) -- VYNE Therapeutics Inc. (Nasdaq: VYNE) (“VYNE” or the “Company”), a clinical-stage biopharmaceutical company developing proprietary, innovative and differentiated therapies for the treatment of immuno-inflammatory conditions, today announced that the Company has signed a securities purchase agreement with certain healthcare |
VYNE Price Returns
| 1-mo | 30.63% |
| 3-mo | -16.40% |
| 6-mo | 15.47% |
| 1-year | -44.41% |
| 3-year | -95.72% |
| 5-year | -99.25% |
| YTD | -10.30% |
| 2023 | -13.70% |
| 2022 | -85.29% |
| 2021 | -83.86% |
| 2020 | -65.95% |
| 2019 | N/A |
Loading social stream, please wait...