
Vizio Holding Corp. (VZIO): Price and Financial Metrics
VZIO Price/Volume Stats
| Current price | $11.02 | 52-week high | $11.28 |
| Prev. close | $11.00 | 52-week low | $4.82 |
| Day low | $10.96 | Volume | 2,062,700 |
| Day high | $11.07 | Avg. volume | 2,565,445 |
| 50-day MA | $10.77 | Dividend yield | N/A |
| 200-day MA | $9.02 | Market Cap | 2.18B |
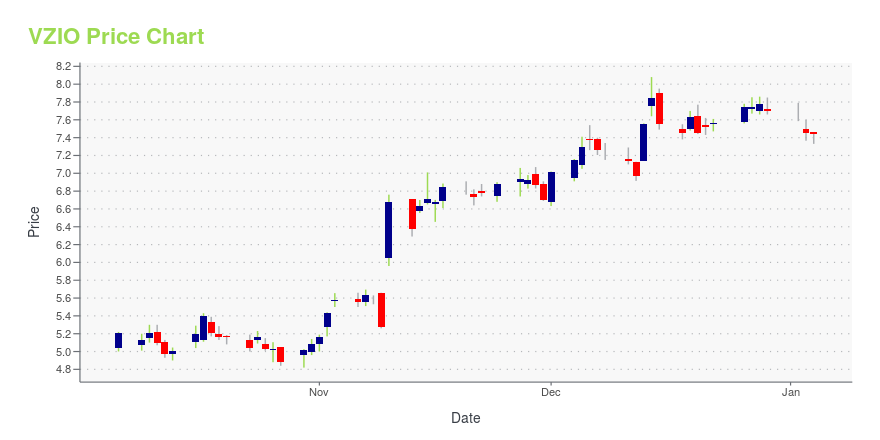
VZIO Stock Price Chart Interactive Chart >
Vizio Holding Corp. (VZIO) Company Bio
Vizio Holding Corp., through its subsidiaries, offers Smart TVs, sound bars, speakers, and remote controls in the United States. It operates SmartCast operating system that delivers content and applications; supports various streaming content apps, such as Amazon Prime Video, Apple TV+, Disney+, Hulu, Netflix, Peacock, and YouTube TV; and hosts ad-supported apps, WatchFree, and VIZIO Free Channels. The company also offers advertising and related services, such as Ad inventory, promotional ads, and viewing data; data licensing; and content distribution, transactions, and promotion services. The company was founded in 2002 and is based in Irvine, California.
Latest VZIO News From Around the Web
Below are the latest news stories about VIZIO HOLDING CORP that investors may wish to consider to help them evaluate VZIO as an investment opportunity.
VIZIO to Participate in 26th Annual Needham Growth ConferenceIRVINE, Calif., December 21, 2023--VIZIO Holding Corp. (NYSE:VZIO) today announced that its Chief Financial Officer, Adam Townsend, will participate in the 26th Annual Needham Growth Conference on Thursday, January 18, 2024. |
VIZIO Delivers Faster Loading, Navigation Experience with VIZIO Home EnhancementIRVINE, Calif., December 20, 2023--VIZIO Delivers Faster Loading, Navigation Experience with VIZIO Home Enhancement |
VIZIO Raises the Holiday Spirit With Big Savings on Smart TVs and SoundbarsIRVINE, Calif., December 18, 2023--VIZIO Raises the Holiday Spirit With Big Savings on Smart TVs and Soundbars |
VIZIO Holding Corp.'s (NYSE:VZIO) Financials Are Too Obscure To Link With Current Share Price Momentum: What's In Store For the Stock?VIZIO Holding (NYSE:VZIO) has had a great run on the share market with its stock up by a significant 27% over the last... |
JPMorgan names Amazon, Google as 'top picks' for 2024 stocksJPMorgan names Amazon and Google among top internet picks for 2024. |
VZIO Price Returns
| 1-mo | 2.99% |
| 3-mo | 2.51% |
| 6-mo | 49.93% |
| 1-year | 55.87% |
| 3-year | -53.89% |
| 5-year | N/A |
| YTD | 43.12% |
| 2023 | 3.91% |
| 2022 | -61.86% |
| 2021 | N/A |
| 2020 | N/A |
| 2019 | N/A |
Loading social stream, please wait...