Veeva Systems Inc. (VEEV): Price and Financial Metrics

Veeva Systems Inc. (VEEV): $233.39

0.71 (+0.31%)

POWR Rating

Component Grades

Momentum

D

Stability

C

Sentiment

Quality

B

Add VEEV to Watchlist
Sign Up

Industry: Medical - Services

Industry

C

Ranked

#19 of 65

in industry

VEEV Price/Volume Stats

Current price $233.39 52-week high $236.90
Prev. close $232.68 52-week low $160.21
Day low $231.89 Volume 586,200
Day high $235.00 Avg. volume 969,507
50-day MA $219.75 Dividend yield N/A
200-day MA $201.34 Market Cap 37.58B

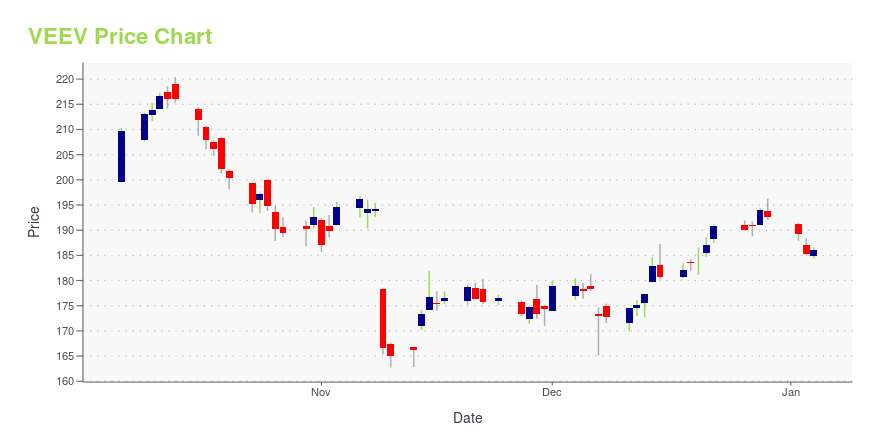
VEEV Stock Price Chart Interactive Chart >

VEEV POWR Grades

  • Quality is the dimension where VEEV ranks best; there it ranks ahead of 94.93% of US stocks.
  • VEEV's strongest trending metric is Quality; it's been moving down over the last 26 weeks.
  • VEEV's current lowest rank is in the Value metric (where it is better than 14.77% of US stocks).

VEEV Stock Summary

  • VEEV has a market capitalization of $29,818,488,038 -- more than approximately 91.86% of US stocks.
  • With a one year PEG ratio of 546.45, VEEVA SYSTEMS INC is expected to have a higher PEG ratio (a measure of how expensive a stock is relative to its expected earnings growth) than 94.35% of US stocks.
  • VEEV's price/sales ratio is 12.98; that's higher than the P/S ratio of 91.63% of US stocks.
  • Stocks that are quantitatively similar to VEEV, based on their financial statements, market capitalization, and price volatility, are MPWR, MANH, LSCC, SNAP, and ME.
  • VEEV's SEC filings can be seen here. And to visit VEEVA SYSTEMS INC's official web site, go to www.veeva.com.

VEEV Valuation Summary

  • In comparison to the median Healthcare stock, VEEV's price/sales ratio is 513.64% higher, now standing at 13.5.
  • Over the past 124 months, VEEV's price/earnings ratio has gone down 970.1.

Below are key valuation metrics over time for VEEV.

Stock Date P/S P/B P/E EV/EBIT
VEEV 2023-12-29 13.5 7.1 54.7 56.1
VEEV 2023-12-28 13.6 7.1 55.1 56.5
VEEV 2023-12-27 13.4 7.0 54.2 55.6
VEEV 2023-12-26 13.3 7.0 54.0 55.3
VEEV 2023-12-22 13.4 7.0 54.2 55.6
VEEV 2023-12-21 13.1 6.9 53.1 54.4

VEEV Growth Metrics

    The 3 year net income to common stockholders growth rate now stands at 59.07%.
  • The 4 year price growth rate now stands at 217.28%.
  • Its 2 year net income to common stockholders growth rate is now at 31.09%.
Over the past 49 months, VEEV's revenue has gone up $1,262,364,000.

The table below shows VEEV's growth in key financial areas (numbers in millions of US dollars).

Date Revenue Operating Cash Flow Net Income to Common Stock
2022-09-30 2,077.17 771.127 396.269
2022-06-30 2,000.93 741.426 393.681
2022-03-31 1,922.306 767.105 411.938
2021-12-31 1,850.777 764.463 427.39
2021-09-30 1,762.039 778.76 433.212
2021-06-30 1,663.447 761.204 424.302

VEEV's Quality Factors

The “Quality” component of the POWR Ratings focuses on 31 different factors of a companies fundamentals and operational strength. Here are some key insights as we drill into the specifics of these quality attributes.
  • VEEV has a Quality Grade of A, ranking ahead of 97.34% of graded US stocks.
  • VEEV's asset turnover comes in at 0.545 -- ranking 298th of 561 Business Services stocks.
  • WLDN, BNFT, and VSEC are the stocks whose asset turnover ratios are most correlated with VEEV.

The table below shows VEEV's key quality metrics over time.

Period Asset Turnover Gross Margin ROIC
2021-07-31 0.545 0.726 0.455
2021-04-30 0.549 0.725 0.471
2021-01-31 0.555 0.721 0.453
2020-10-31 0.565 0.718 0.458
2020-07-31 0.564 0.720 0.508
2020-04-30 0.567 0.722 0.522

Veeva Systems Inc. (VEEV) Company Bio


Veeva Systems provides cloud-based software solutions for the life sciences industry in North America, Europe, the Asia Pacific, and Latin America. The company was founded in 2007 and is based in Pleasanton, California.


VEEV Latest News Stream


Event/Time News Detail
Loading, please wait...

VEEV Latest Social Stream


Loading social stream, please wait...

View Full VEEV Social Stream

Latest VEEV News From Around the Web

Below are the latest news stories about VEEVA SYSTEMS INC that investors may wish to consider to help them evaluate VEEV as an investment opportunity.

Veeva Systems' (NYSE:VEEV) Returns On Capital Not Reflecting Well On The Business

If you're not sure where to start when looking for the next multi-bagger, there are a few key trends you should keep an...

Yahoo | December 28, 2023

A Look At The Fair Value Of Veeva Systems Inc. (NYSE:VEEV)

Key Insights Using the 2 Stage Free Cash Flow to Equity, Veeva Systems fair value estimate is US$198 Veeva Systems...

Yahoo | December 24, 2023

Here's Why You Should Retain Veeva Systems (VEEV) Stock Now

Veeva Systems' (VEEV) strong product portfolio raises optimism about the stock.

Yahoo | December 22, 2023

12 Most Promising Gene Editing Stocks According to Hedge Funds

In this piece, we will take a look at the 12 most promising gene editing stocks according to hedge funds. If you want to skip our take on how the gene editing industry sits right at the top of the global innovation food chain, then you can take a look at the 5 Most Promising […]

Yahoo | December 20, 2023

Veeva Systems (VEEV) Vault Quality Offerings Adopted by Recipharm

Veeva Systems' (VEEV) Vault Quality Suite applications are expected to aid Recipharm in boosting its operational efficiencies.

Yahoo | December 20, 2023

Read More 'VEEV' Stories Here

VEEV Price Returns

1-mo 4.70%
3-mo 21.23%
6-mo 14.72%
1-year 30.63%
3-year -6.61%
5-year 83.97%
YTD 21.23%
2023 19.30%
2022 -36.83%
2021 -6.16%
2020 93.55%
2019 57.48%

Get Free Updates

Join thousands of investors who get the latest news, insights and top rated picks from StockNews.com!