
Walgreens Boots Alliance Inc. (WBA): Price and Financial Metrics
WBA Price/Volume Stats
| Current price | $11.82 | 52-week high | $31.32 |
| Prev. close | $11.51 | 52-week low | $10.69 |
| Day low | $11.37 | Volume | 14,503,000 |
| Day high | $11.83 | Avg. volume | 15,737,746 |
| 50-day MA | $14.16 | Dividend yield | 8.9% |
| 200-day MA | $19.57 | Market Cap | 10.20B |
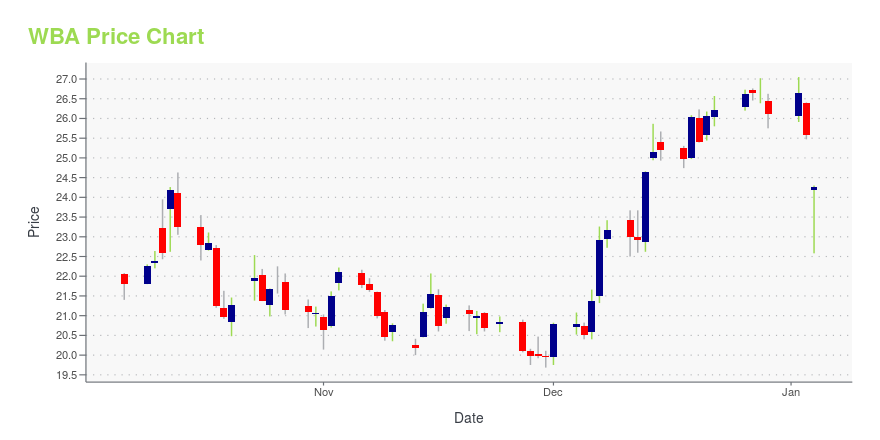
WBA Stock Price Chart Interactive Chart >
Walgreens Boots Alliance Inc. (WBA) Company Bio
Walgreens Boots Alliance, Inc. is an Anglo-Swiss-American holding company headquartered in Deerfield, Illinois that owns the retail pharmacy chains Walgreens and Boots, as well as several pharmaceutical manufacturing and distribution companies. The company was formed on December 31, 2014, after Walgreens purchased the 55% stake in Alliance Boots that it did not already own. The total price of the acquisition was $4.9 billion in cash and 144.3 million common shares with fair value of $10.7 billion. Walgreens had previously purchased 45% of the company for $4.0 billion and 83.4 million common shares in August 2012 with an option to purchase the remaining shares within three years. Walgreens became a subsidiary of the newly created company after the transactions were completed.As of 2021, Walgreens Boots Alliance is ranked #16 on the Fortune 500 rankings of the largest United States corporations by total revenue. (Source:Wikipeda)
Latest WBA News From Around the Web
Below are the latest news stories about WALGREENS BOOTS ALLIANCE INC that investors may wish to consider to help them evaluate WBA as an investment opportunity.
Financial Freedom: 7 Exceptional High-Yield Stocks for Lasting Passive GainsThe pursuit of financial freedom often conjures up images of dynamic markets, strategic maneuvers, and the allure of high-yield stocks. |
Earnings Preview: Walgreens Boots Alliance (WBA) Q1 Earnings Expected to DeclineWalgreens (WBA) doesn't possess the right combination of the two key ingredients for a likely earnings beat in its upcoming report. Get prepared with the key expectations. |
Walgreens, Nike, Moderna: Bargain hunting stocksThe most recent bull market run has been widely described as "weird," with several household stocks underperforming during the bull run on S&P 500 (^GSPC) components. Yahoo Finance Reporter Madison Mills showcases three of these companies — Moderna (MRNA), Walgreens (WBA), and Nike (NKE) — where investors may find the most value for a bargain price on the stocks. For more expert insight and the latest market action, click here to watch this full episode of Yahoo Finance Live. |
11 Hot Healthcare Stocks To Buy NowIn this article, we will be taking a look at 11 hot healthcare stocks to buy now. To skip our detailed analysis of the healthcare sector, you can go directly to see the 5 Hot Healthcare Stocks To Buy Now. Healthcare is a vital part of daily living for everyone, whether it be to cure […] |
Is It Time to Buy the Dow Jones' 3 Worst-Performing Stocks This Year?These stocks have significantly underperformed the market. But are they really "cheap"? |
WBA Price Returns
| 1-mo | -3.04% |
| 3-mo | -32.29% |
| 6-mo | -46.65% |
| 1-year | -57.61% |
| 3-year | -70.58% |
| 5-year | -72.82% |
| YTD | -53.58% |
| 2023 | -25.09% |
| 2022 | -25.06% |
| 2021 | 35.78% |
| 2020 | -29.37% |
| 2019 | -10.99% |
WBA Dividends
| Ex-Dividend Date | Type | Payout Amount | Change | ||||||
|---|---|---|---|---|---|---|---|---|---|
| Loading, please wait... | |||||||||
Continue Researching WBA
Want to do more research on Walgreens Boots Alliance Inc's stock and its price? Try the links below:Walgreens Boots Alliance Inc (WBA) Stock Price | Nasdaq
Walgreens Boots Alliance Inc (WBA) Stock Quote, History and News - Yahoo Finance
Walgreens Boots Alliance Inc (WBA) Stock Price and Basic Information | MarketWatch
Loading social stream, please wait...