WESCO International, Inc. (WCC): Price and Financial Metrics
WCC Price/Volume Stats
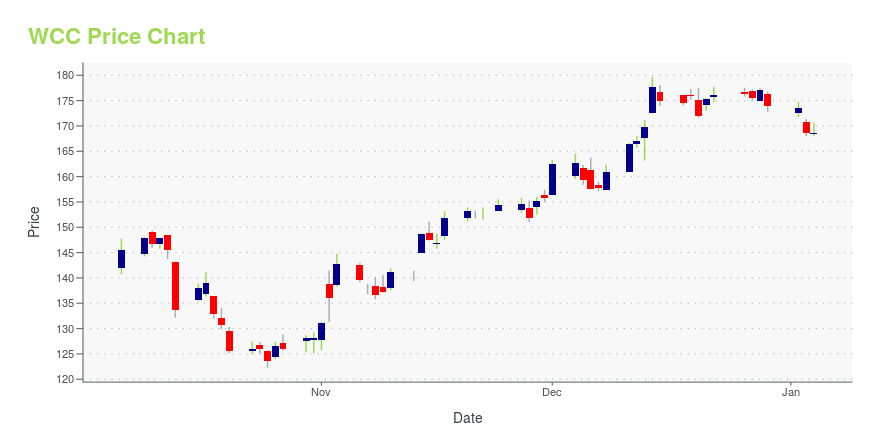
Current price | $149.89 | 52-week high | $185.23 |
Prev. close | $150.55 | 52-week low | $112.08 |
Day low | $147.00 | Volume | 98,847 |
Day high | $150.00 | Avg. volume | 634,811 |
50-day MA | $161.00 | Dividend yield | 0.98% |
200-day MA | $149.81 | Market Cap | 7.70B |
WCC Stock Price Chart Interactive Chart >
WCC POWR Grades
- WCC scores best on the Momentum dimension, with a Momentum rank ahead of 95.66% of US stocks.
- The strongest trend for WCC is in Growth, which has been heading down over the past 179 days.
- WCC ranks lowest in Quality; there it ranks in the 30th percentile.
WCC Stock Summary
- WCC has a higher market value than 81.71% of US stocks; more precisely, its current market capitalization is $7,906,485,266.
- WESCO INTERNATIONAL INC's capital turnover -- a measure of revenue relative to shareholder's equity -- is better than 89.72% of US listed stocks.
- With a price/sales ratio of 0.36, WESCO INTERNATIONAL INC has a higher such ratio than just 12.42% of stocks in our set.
- If you're looking for stocks that are quantitatively similar to WESCO INTERNATIONAL INC, a group of peers worth examining would be ABG, FCFS, GPI, ARW, and AN.
- Visit WCC's SEC page to see the company's official filings. To visit the company's web site, go to www.wesco.com.
WCC Valuation Summary
- WCC's EV/EBIT ratio is 9.1; this is 42.41% lower than that of the median Industrials stock.
- WCC's price/earnings ratio has moved down 0 over the prior 243 months.
Below are key valuation metrics over time for WCC.
Stock | Date | P/S | P/B | P/E | EV/EBIT |
---|---|---|---|---|---|
WCC | 2023-09-15 | 0.4 | 1.6 | 9.9 | 9.1 |
WCC | 2023-09-14 | 0.4 | 1.7 | 10.1 | 9.2 |
WCC | 2023-09-13 | 0.4 | 1.6 | 10.0 | 9.1 |
WCC | 2023-09-12 | 0.4 | 1.7 | 10.2 | 9.2 |
WCC | 2023-09-11 | 0.4 | 1.7 | 10.2 | 9.2 |
WCC | 2023-09-08 | 0.4 | 1.7 | 10.3 | 9.3 |
WCC Growth Metrics
- Its 4 year price growth rate is now at -57.39%.
- Its 4 year net income to common stockholders growth rate is now at 108.66%.
- The year over year cash and equivalents growth rate now stands at -33.7%.

The table below shows WCC's growth in key financial areas (numbers in millions of US dollars).
Date | Revenue | Operating Cash Flow | Net Income to Common Stock |
---|---|---|---|
2022-09-30 | 20,713.54 | -516.153 | 751.556 |
2022-06-30 | 19,995.95 | -340.188 | 631.55 |
2022-03-31 | 19,108.22 | -225.263 | 530.039 |
2021-12-31 | 18,217.51 | 67.138 | 407.974 |
2021-09-30 | 17,494.43 | 297.663 | 260.543 |
2021-06-30 | 16,907.91 | 514.038 | 221.466 |
WCC's Quality Factors
The “Quality” component of the POWR Ratings focuses on 31 different factors of a companies fundamentals and operational strength. Here are some key insights as we drill into the specifics of these quality attributes.- WCC has a Quality Grade of D, ranking ahead of 24.45% of graded US stocks.
- WCC's asset turnover comes in at 1.411 -- ranking 57th of 105 Wholesale stocks.
- USFD, PFGC, and LAWS are the stocks whose asset turnover ratios are most correlated with WCC.
The table below shows WCC's key quality metrics over time.
Period | Asset Turnover | Gross Margin | ROIC |
---|---|---|---|
2021-06-30 | 1.411 | 0.197 | 0.072 |
2021-03-31 | 1.216 | 0.192 | 0.048 |
2020-12-31 | 1.211 | 0.189 | 0.046 |
2020-09-30 | 1.217 | 0.189 | 0.053 |
2020-06-30 | 1.229 | 0.188 | 0.052 |
2020-03-31 | 1.643 | 0.188 | 0.099 |
WCC Price Target
For more insight on analysts targets of WCC, see our WCC price target page. And for a list of of all stocks sorted by upside potential based on analyst target price, see our Top Price Target page.
Average Price Target | $137.50 | Average Broker Recommendation | 1.5 (Moderate Buy) |
WESCO International, Inc. (WCC) Company Bio
Wesco International distributes electrical, industrial, and communications maintenance, repair, and operating (MRO) products; and original equipment manufacturers products and construction materials in North America and internationally. The company was founded in 1922 and is based in Pittsburgh, Pennsylvania.
Latest WCC News From Around the Web
Below are the latest news stories about WESCO INTERNATIONAL INC that investors may wish to consider to help them evaluate WCC as an investment opportunity.
Why Is Avnet (AVT) Down 0.5% Since Last Earnings Report?Avnet (AVT) reported earnings 30 days ago. What's next for the stock? We take a look at earnings estimates for some clues. |
Wesco Reports Progress on 2030 Goals in Latest Sustainability ReportWesco International (NYSE:WCC), a leading provider of business-to-business distribution, logistics services and supply chain solutions, issued its annual sustainability report today. The report outlines Wesco's progress and key initiatives for advancing its environmental, social and governance (ESG) goals set in the 2021 report that include reducing greenhouse gas emissions by 30%, reducing landfill waste intensity by 15% across U.S. and Canadian locations, achieving a 15% reduction in total rec |
Is It Smart To Buy WESCO International, Inc. (NYSE:WCC) Before It Goes Ex-Dividend?WESCO International, Inc. ( NYSE:WCC ) stock is about to trade ex-dividend in 3 days. The ex-dividend date is one... |
These Stocks Were Big Inflation Winners. Now They’re at Risk of a Slowdown.Ferguson, Pool Corp., Watsco, and Wesco do well when prices are increasing and inventory gets marked up. What happens when inflation slows? |
Here’s How WESCO International (WCC) Benefitted from AcquisitionDiamond Hill Capital, an investment management company, released its “Mid Cap Strategy” second-quarter 2023 investor letter. A copy of the same can be downloaded here. The portfolio delivered positive results in the second quarter while modestly trailing the Russell Midcap Index. The healthcare holdings positively contributed to the relative performance while the information technology and materials […] |
WCC Price Returns
1-mo | -1.79% |
3-mo | -10.51% |
6-mo | 9.02% |
1-year | 20.47% |
3-year | 252.73% |
5-year | 142.71% |
YTD | 20.58% |
2022 | -4.86% |
2021 | 67.63% |
2020 | 32.18% |
2019 | 23.73% |
2018 | -29.57% |
WCC Dividends
Ex-Dividend Date | Type | Payout Amount | Change | ||||||
---|---|---|---|---|---|---|---|---|---|
Loading, please wait... |
Continue Researching WCC
Want to do more research on Wesco International Inc's stock and its price? Try the links below:Wesco International Inc (WCC) Stock Price | Nasdaq
Wesco International Inc (WCC) Stock Quote, History and News - Yahoo Finance
Wesco International Inc (WCC) Stock Price and Basic Information | MarketWatch
Loading social stream, please wait...