Walker & Dunlop, Inc (WD): Price and Financial Metrics
GET POWR RATINGS... FREE!
WD POWR Grades
- WD scores best on the Quality dimension, with a Quality rank ahead of 84.23% of US stocks.
- WD's strongest trending metric is Value; it's been moving down over the last 179 days.
- WD's current lowest rank is in the Value metric (where it is better than 12.5% of US stocks).
WD Stock Summary
- WD's one year PEG ratio, measuring expected growth in earnings next year relative to current common stock price is 268.29 -- higher than 90.21% of US-listed equities with positive expected earnings growth.
- The price/operating cash flow metric for Walker & Dunlop Inc is higher than only 17.31% of stocks in our set with a positive cash flow.
- Walker & Dunlop Inc's shareholder yield -- a measure of how much capital is returned to stockholders via dividends and buybacks -- is 10.3%, greater than the shareholder yield of 84.38% of stocks in our set.
- If you're looking for stocks that are quantitatively similar to Walker & Dunlop Inc, a group of peers worth examining would be OZK, BZH, WRLD, SFNC, and BKU.
- WD's SEC filings can be seen here. And to visit Walker & Dunlop Inc's official web site, go to www.walkerdunlop.com.
WD Valuation Summary
- WD's EV/EBIT ratio is 14.5; this is 68.6% higher than that of the median Financial Services stock.
- Over the past 130 months, WD's price/sales ratio has gone up 0.5.
- WD's price/earnings ratio has moved up 3.9 over the prior 130 months.
Below are key valuation metrics over time for WD.
Stock | Date | P/S | P/B | P/E | EV/EBIT |
---|---|---|---|---|---|
WD | 2019-03-28 | 2.1 | 1.7 | 9.5 | 12.9 |
WD | 2016-10-14 | 1.5 | 1.4 | 8.4 | 20.7 |
WD | 2012-07-09 | 1.8 | 1.7 | 8.4 | 8.9 |
WD | 2012-06-21 | 1.8 | 1.6 | 8.2 | 8.8 |
WD | 2011-03-10 | 3.1 | 8.8 | 10.9 | 14.5 |
WD | 2011-02-14 | 3.0 | 8.7 | 10.7 | 14.3 |
WD Growth Metrics
- Its 2 year revenue growth rate is now at 23.28%.
- The year over year price growth rate now stands at 99.82%.
- The 2 year net income to common stockholders growth rate now stands at -13.57%.

The table below shows WD's growth in key financial areas (numbers in millions of US dollars).
Date | Revenue | Operating Cash Flow | Net Income to Common Stock |
---|---|---|---|
2021-12-31 | 1,259.178 | 870.455 | 265.762 |
2021-09-30 | 1,201.698 | 688.519 | 268.93 |
2021-06-30 | 1,102.424 | 170.615 | 250.399 |
2021-03-31 | 1,073.838 | 196.948 | 256.4 |
2020-12-31 | 1,083.707 | -1,411.37 | 246.177 |
2020-09-30 | 951.188 | -1,776.279 | 205.994 |
WD's Quality Factors
The “Quality” component of the POWR Ratings focuses on 31 different factors of a companies fundamentals and operational strength. Here are some key insights as we drill into the specifics of these quality attributes.- WD has a Quality Grade of C, ranking ahead of 63.71% of graded US stocks.
- WD's asset turnover comes in at 0.258 -- ranking 27th of 430 Banking stocks.
- LC, OPOF, and RM are the stocks whose asset turnover ratios are most correlated with WD.
The table below shows WD's key quality metrics over time.
Period | Asset Turnover | Gross Margin | ROIC |
---|---|---|---|
2021-06-30 | 0.258 | 1 | 0.055 |
2021-03-31 | 0.253 | 1 | 0.057 |
2020-12-31 | 0.254 | 1 | 0.054 |
2020-09-30 | 0.252 | 1 | 0.052 |
2020-06-30 | 0.287 | 1 | 0.062 |
2020-03-31 | 0.289 | 1 | 0.060 |
WD Price Target
For more insight on analysts targets of WD, see our WD price target page. And for a list of of all stocks sorted by upside potential based on analyst target price, see our Top Price Target page.
Average Price Target | $134.00 | Average Broker Recommendation | 1.38 (Strong Buy) |
WD Stock Price Chart Interactive Chart >
WD Price/Volume Stats
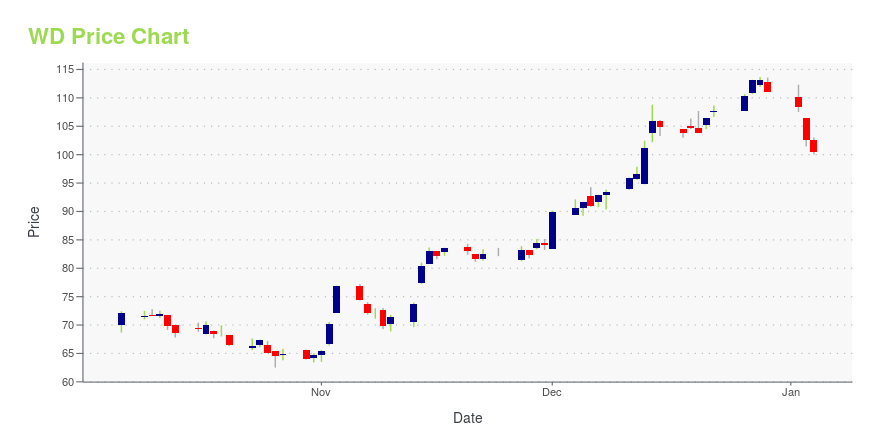
Current price | $106.50 | 52-week high | $156.77 |
Prev. close | $101.27 | 52-week low | $95.60 |
Day low | $101.92 | Volume | 141,000 |
Day high | $106.74 | Avg. volume | 168,063 |
50-day MA | $120.57 | Dividend yield | 2.37% |
200-day MA | $128.71 | Market Cap | 3.53B |
Walker & Dunlop, Inc (WD) Company Bio
Walker & Dunlop provides financing and investment sales to owners of multifamily and commercial properties. The company was founded in 1937 and is based in Bethesda, Maryland.
Latest WD News From Around the Web
Below are the latest news stories about Walker & Dunlop Inc that investors may wish to consider to help them evaluate WD as an investment opportunity.
Ellington (EFC) Taps Reverse Mortgage Space, To Buy LongbridgeEllington Financial's (EFC) purchase of controlling interest in Longbridge will enable it to tap the latter's industry-leading position in the reverse mortgage space. |
Walker & Dunlop Expands Seniors Housing Property Sales Team to California with Experienced HireWalker & Dunlop, Inc. announced today that it has hired Gideon Orion as Managing Director on its investment sales platform. Mr. Orion is based in Los Angeles, California and will join the firm's national seniors housing property sales team led by Managing Director, Joshua Jandris. Mr. Orion will be focused on originating and executing seniors housing property sales opportunities across the United States. |
Webster Financial (WBS) Snaps Up Bend Financial for HSA BankWebster Financial's (WBS) buyout of Bend Financial will enable its arm, HSA Bank, to advance its digital experience initiative and equip consumers to better understand their healthcare savings accounts. |
Walker & Dunlop completes $66.2M sale of mixed-use property in DenverWalker & Dunlop (WD) completed the $66.2M sale of The Lydian, a mixed-use property in Denver, Colorado.The Class A luxury building is comprised of 129 apartment units, ~8.2K sq. ft |
Walker & Dunlop Completes $66 Million Sale and Financing of Mixed-Use Building in Downtown DenverWalker & Dunlop, Inc. announced today that it completed the $66,200,000 sale of The Lydian, a mixed-use property located in the heart of Denver, Colorado. Built in 2018, the Class A, luxury building is comprised of 129 apartment units, 8,176 square feet of ground floor retail space, and 14,500 square feet of designated coworking office space. |
WD Price Returns
1-mo | -10.15% |
3-mo | -22.14% |
6-mo | -25.75% |
1-year | 7.26% |
3-year | 118.06% |
5-year | 149.10% |
YTD | -28.70% |
2021 | 67.03% |
2020 | 45.89% |
2019 | 52.68% |
2018 | -7.15% |
2017 | 52.24% |
WD Dividends
Ex-Dividend Date | Type | Payout Amount | Change | ||||||
---|---|---|---|---|---|---|---|---|---|
Loading, please wait... |
Continue Researching WD
Want to do more research on Walker & Dunlop Inc's stock and its price? Try the links below:Walker & Dunlop Inc (WD) Stock Price | Nasdaq
Walker & Dunlop Inc (WD) Stock Quote, History and News - Yahoo Finance
Walker & Dunlop Inc (WD) Stock Price and Basic Information | MarketWatch
Loading social stream, please wait...