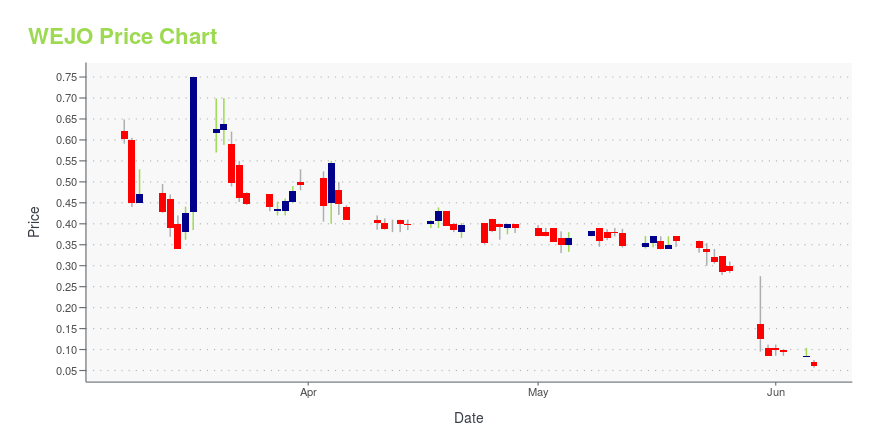
Wejo Group Limited (WEJO): Price and Financial Metrics
WEJO Price/Volume Stats
| Current price | $0.05 | 52-week high | $2.44 |
| Prev. close | $0.07 | 52-week low | $0.05 |
| Day low | $0.05 | Volume | 23,391,500 |
| Day high | $0.07 | Avg. volume | 1,565,132 |
| 50-day MA | $0.34 | Dividend yield | N/A |
| 200-day MA | $0.71 | Market Cap | 4.95M |
WEJO Stock Price Chart Interactive Chart >
Wejo Group Limited (WEJO) Company Bio
Wejo Group Limited develops cloud-based data exchange platform, which helps in sharing and accessing connected car data. Its platform provides data hosting, insights, and monetization of connected car data. The products include wejo journey intelligence, wejo traffic intelligence, and source data for vehicle movements, and driving events. Wejo Group Limited was incorporated in 2013 and is based in Manchester, United Kingdom.
Latest WEJO News From Around the Web
Below are the latest news stories about WEJO GROUP LTD that investors may wish to consider to help them evaluate WEJO as an investment opportunity.
Why Is Recruiter.com (RCRT) Stock Down 22% Today?Recruiter.com (RCRT) stock is falling on Wednesday after the company announced a business combination with GoLogiq (GOLQ). |
Why Is Vaxart (VXRT) Stock Down 25% Today?Vaxart (VXRT) stock is taking a beating on Wednesday as investors react to the company announcing a proposed public share offering. |
Today’s Biggest Pre-Market Stock Movers: 10 Top Gainers and Losers on WednesdayWe're starting the day off right with a breakdown of the biggest pre-market stock movers worth reading about on Wednesday! |
Why Is SaverOne 2014 (SVRE) Stock Up 22% Today?SaverOne 2014 (SVRE) stock is climbing higher on Wednesday with heavy trading after getting a new order from Universal Trucks Israel. |
Why Is Wejo (WEJO) Stock Up 38% Today?Wejo (WEJO) stock is rallying on Wednesday despite the EV data, analytics, and software-as-a-service company revealing a delisting notice. |
WEJO Price Returns
| 1-mo | N/A |
| 3-mo | N/A |
| 6-mo | N/A |
| 1-year | N/A |
| 3-year | -99.50% |
| 5-year | N/A |
| YTD | N/A |
| 2023 | 0.00% |
| 2022 | -92.97% |
| 2021 | N/A |
| 2020 | N/A |
| 2019 | N/A |


Loading social stream, please wait...