
Welltower Inc. (WELL): Price and Financial Metrics
WELL Price/Volume Stats
| Current price | $109.78 | 52-week high | $111.85 |
| Prev. close | $108.49 | 52-week low | $78.38 |
| Day low | $108.24 | Volume | 2,104,600 |
| Day high | $110.49 | Avg. volume | 2,667,266 |
| 50-day MA | $104.07 | Dividend yield | 2.23% |
| 200-day MA | $93.48 | Market Cap | 65.64B |
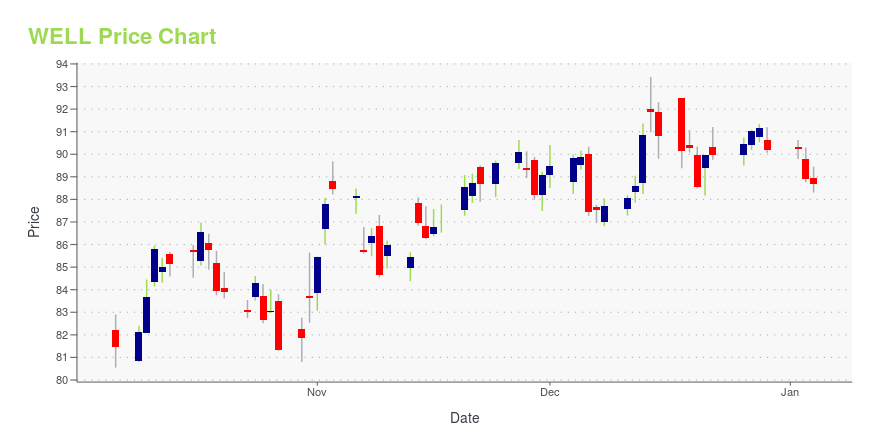
WELL Stock Price Chart Interactive Chart >
Welltower Inc. (WELL) Company Bio
Welltower Inc. is a real estate investment trust that invests in healthcare infrastructure. It ranked 561st on the Fortune 1000 in 2021, and is a component of the S&P 500. As of early 2021, the firm had an enterprise value of $50 billion and is the world's largest healthcare real estate investment trust. (Source:Wikipedia)
Latest WELL News From Around the Web
Below are the latest news stories about WELLTOWER INC that investors may wish to consider to help them evaluate WELL as an investment opportunity.
JP Morgan Upgrades Six REITs To Start The WeekWith real estate investment trusts (REITs) showing strength following the Federal Reserve's recent announcement of three possible rate cuts in 2024, analysts are scurrying to update their ratings on REITs. A positive start to the week was solidified by two analysts at JP Morgan upgrading six REITs from a cross-section of REIT subsectors. All six REITs were upgraded from Neutral to Overweight. Take a look at the six REITs receiving upgrades this week. EPR Properties (NYSE:EPR) is a Kansas City, M |
November’s Surprising Sector WinnerReal estate investment trusts (REITs), which have been beaten down by surging interest rates and economic uncertainty, are now showing signs of strength. |
7 Top-Rated Growth Stocks That Analysts Are Loving NowAs the market rally continues to build steam, you may be looking for top-rated growth stocks now. |
Why Is Welltower (WELL) Up 6.8% Since Last Earnings Report?Welltower (WELL) reported earnings 30 days ago. What's next for the stock? We take a look at earnings estimates for some clues. |
Shopify downgraded to Underweight at Piper Sandler: 4 big analyst cutsHere is your Pro Recap of the biggest analyst cuts you may have missed since yesterday: downgrades at Shopify, ChargePoint, Welltower, and American Axle & Manufacturing. Unlock the potential of InvestingPro for up to 55% off this Cyber Monday and never miss out on a market winner again. Shopify (NYSE:SHOP) fell more than 2% pre-market today after Piper Sandler downgraded the company to Underweight from Neutral and cut its price target to $56.00 from $58.00, as reported in real-time on InvestingPro. |
WELL Price Returns
| 1-mo | 7.81% |
| 3-mo | 17.09% |
| 6-mo | 27.22% |
| 1-year | 38.87% |
| 3-year | 35.84% |
| 5-year | 56.96% |
| YTD | 23.30% |
| 2023 | 41.79% |
| 2022 | -21.18% |
| 2021 | 36.98% |
| 2020 | -17.19% |
| 2019 | 23.04% |
WELL Dividends
| Ex-Dividend Date | Type | Payout Amount | Change | ||||||
|---|---|---|---|---|---|---|---|---|---|
| Loading, please wait... | |||||||||
Continue Researching WELL
Want to do more research on Welltower Inc's stock and its price? Try the links below:Welltower Inc (WELL) Stock Price | Nasdaq
Welltower Inc (WELL) Stock Quote, History and News - Yahoo Finance
Welltower Inc (WELL) Stock Price and Basic Information | MarketWatch
Loading social stream, please wait...