Weyco Group, Inc. (WEYS): Price and Financial Metrics
WEYS Price/Volume Stats
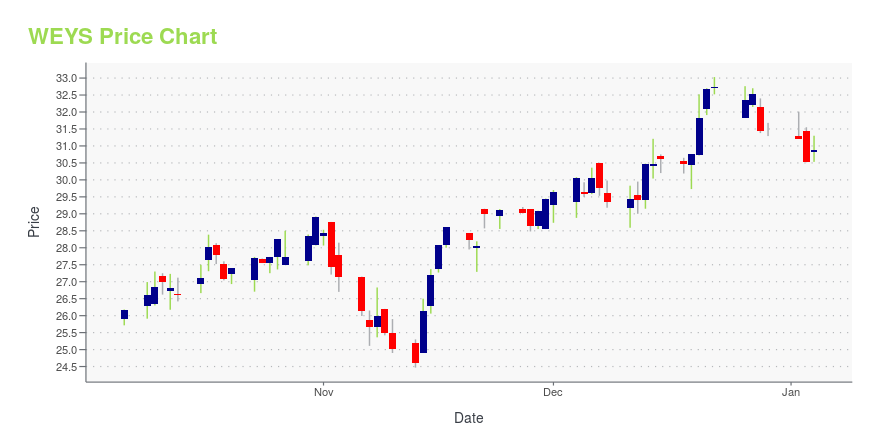
Current price | $27.14 | 52-week high | $32.45 |
Prev. close | $27.15 | 52-week low | $19.89 |
Day low | $27.14 | Volume | 4,600 |
Day high | $27.55 | Avg. volume | 11,229 |
50-day MA | $26.20 | Dividend yield | 3.71% |
200-day MA | $25.06 | Market Cap | 258.07M |
WEYS Stock Price Chart Interactive Chart >
WEYS POWR Grades
- Growth is the dimension where WEYS ranks best; there it ranks ahead of 93.29% of US stocks.
- WEYS's strongest trending metric is Quality; it's been moving up over the last 179 days.
- WEYS's current lowest rank is in the Momentum metric (where it is better than 32.68% of US stocks).
WEYS Stock Summary
- WEYCO GROUP INC's stock had its IPO on March 26, 1990, making it an older stock than 86.5% of US equities in our set.
- Of note is the ratio of WEYCO GROUP INC's sales and general administrative expense to its total operating expenses; 87.44% of US stocks have a lower such ratio.
- With a year-over-year growth in debt of 246.36%, WEYCO GROUP INC's debt growth rate surpasses 94.24% of about US stocks.
- If you're looking for stocks that are quantitatively similar to WEYCO GROUP INC, a group of peers worth examining would be OCG, PLUS, IZEA, GRNQ, and FXLV.
- WEYS's SEC filings can be seen here. And to visit WEYCO GROUP INC's official web site, go to www.weycogroup.com.
WEYS Valuation Summary
- WEYS's EV/EBIT ratio is 6; this is 56.68% lower than that of the median Consumer Cyclical stock.
- Over the past 243 months, WEYS's price/sales ratio has gone down 0.2.
Below are key valuation metrics over time for WEYS.
Stock | Date | P/S | P/B | P/E | EV/EBIT |
---|---|---|---|---|---|
WEYS | 2023-05-19 | 0.7 | 1.1 | 7.8 | 6.0 |
WEYS | 2023-05-18 | 0.7 | 1.1 | 7.9 | 6.0 |
WEYS | 2023-05-17 | 0.7 | 1.1 | 7.9 | 6.0 |
WEYS | 2023-05-16 | 0.7 | 1.1 | 7.7 | 5.9 |
WEYS | 2023-05-15 | 0.7 | 1.1 | 7.8 | 6.0 |
WEYS | 2023-05-12 | 0.7 | 1.1 | 7.7 | 5.9 |
WEYS Growth Metrics
- The 3 year net income to common stockholders growth rate now stands at 8.47%.
- Its 2 year net cashflow from operations growth rate is now at -137.88%.
- The 2 year revenue growth rate now stands at 2.94%.

The table below shows WEYS's growth in key financial areas (numbers in millions of US dollars).
Date | Revenue | Operating Cash Flow | Net Income to Common Stock |
---|---|---|---|
2022-09-30 | 354.069 | -45.36 | 29.659 |
2022-06-30 | 318.896 | -39.427 | 23.958 |
2022-03-31 | 302.101 | -7.546 | 23.283 |
2021-12-31 | 267.641 | 6.392 | 20.555 |
2021-09-30 | 228.229 | 42.826 | 15.319 |
2021-06-30 | 219.609 | 54.44 | 4.381 |
WEYS's Quality Factors
The “Quality” component of the POWR Ratings focuses on 31 different factors of a companies fundamentals and operational strength. Here are some key insights as we drill into the specifics of these quality attributes.- WEYS has a Quality Grade of B, ranking ahead of 78.93% of graded US stocks.
- WEYS's asset turnover comes in at 0.863 -- ranking 84th of 104 Wholesale stocks.
- CHEF, USFD, and INT are the stocks whose asset turnover ratios are most correlated with WEYS.
The table below shows WEYS's key quality metrics over time.
Period | Asset Turnover | Gross Margin | ROIC |
---|---|---|---|
2021-06-30 | 0.863 | 0.409 | 0.062 |
2021-03-31 | 0.696 | 0.418 | -0.037 |
2020-12-31 | 0.750 | 0.402 | -0.036 |
2020-09-30 | 0.814 | 0.406 | -0.017 |
2020-06-30 | 0.892 | 0.406 | 0.041 |
2020-03-31 | 1.026 | 0.403 | 0.106 |
Weyco Group, Inc. (WEYS) Company Bio
Weyco Group designs and markets footwear for men, women, and children under the Florsheim, Nunn Bush, Stacy Adams, BOGS, Rafters, and Umi brand names. The company was founded in 1896 and is based in Milwaukee, Wisconsin.
Latest WEYS News From Around the Web
Below are the latest news stories about WEYCO GROUP INC that investors may wish to consider to help them evaluate WEYS as an investment opportunity.
Weyco Group (NASDAQ:WEYS) Shareholders Will Want The ROCE Trajectory To ContinueFinding a business that has the potential to grow substantially is not easy, but it is possible if we look at a few key... |
Weyco Group's (NASDAQ:WEYS) Dividend Will Be Increased To $0.25Weyco Group, Inc. ( NASDAQ:WEYS ) will increase its dividend from last year's comparable payment on the 30th of June to... |
Q1 2023 WEYCO Group Inc Earnings CallQ1 2023 WEYCO Group Inc Earnings Call |
Weyco Reports First Quarter Sales And EarningsMILWAUKEE, May 02, 2023 (GLOBE NEWSWIRE) -- Weyco Group, Inc. (NASDAQ: WEYS) (“we,” “our,” “us” and the “Company”) today announced financial results for the quarter ended March 31, 2023. First Quarter 2023Consolidated net sales were a first-quarter record of $86.3 million, up 6% compared to our previous record of $81.4 million in 2022. Consolidated gross earnings increased to 43.1% of net sales compared to 35.8% of net sales in last year’s first quarter, due mainly to higher gross margins in our |
Those who invested in Weyco Group (NASDAQ:WEYS) three years ago are up 70%Thanks in no small measure to Vanguard founder Jack Bogle, it's easy buy a low cost index fund, which should provide... |
WEYS Price Returns
1-mo | 3.16% |
3-mo | 6.81% |
6-mo | 5.26% |
1-year | 0.64% |
3-year | 66.87% |
5-year | -7.58% |
YTD | 30.83% |
2022 | -8.27% |
2021 | 57.52% |
2020 | -36.88% |
2019 | -5.99% |
2018 | 0.79% |
WEYS Dividends
Ex-Dividend Date | Type | Payout Amount | Change | ||||||
---|---|---|---|---|---|---|---|---|---|
Loading, please wait... |
Continue Researching WEYS
Here are a few links from around the web to help you further your research on Weyco Group Inc's stock as an investment opportunity:Weyco Group Inc (WEYS) Stock Price | Nasdaq
Weyco Group Inc (WEYS) Stock Quote, History and News - Yahoo Finance
Weyco Group Inc (WEYS) Stock Price and Basic Information | MarketWatch
Loading social stream, please wait...