Wells Fargo & Company (WFC): Price and Financial Metrics
WFC Price/Volume Stats
Current price | $41.23 | 52-week high | $48.84 |
Prev. close | $42.32 | 52-week low | $35.25 |
Day low | $41.15 | Volume | 16,783,100 |
Day high | $42.39 | Avg. volume | 20,282,246 |
50-day MA | $43.41 | Dividend yield | 3.31% |
200-day MA | $42.32 | Market Cap | 150.85B |
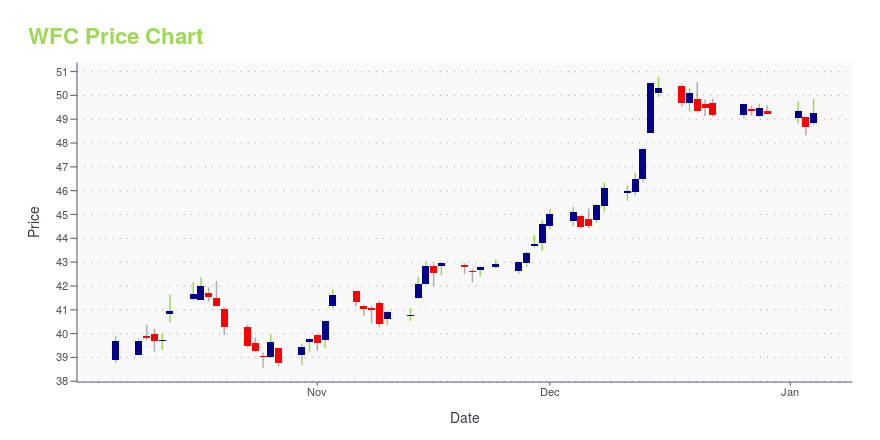
WFC Stock Price Chart Interactive Chart >
WFC POWR Grades
- WFC scores best on the Sentiment dimension, with a Sentiment rank ahead of 80.03% of US stocks.
- The strongest trend for WFC is in Growth, which has been heading down over the past 179 days.
- WFC's current lowest rank is in the Stability metric (where it is better than 36.63% of US stocks).
WFC Stock Summary
- WFC has a higher market value than 98.86% of US stocks; more precisely, its current market capitalization is $158,348,223,980.
- WELLS FARGO & COMPANY's stock had its IPO on January 1, 1986, making it an older stock than 93.16% of US equities in our set.
- Equity multiplier, or assets relative to shareholders' equity, comes in at 10.48 for WELLS FARGO & COMPANY; that's greater than it is for 90.58% of US stocks.
- Stocks that are quantitatively similar to WFC, based on their financial statements, market capitalization, and price volatility, are HSBC, VZ, TMUS, CMCSA, and UPS.
- WFC's SEC filings can be seen here. And to visit WELLS FARGO & COMPANY's official web site, go to www.wellsfargo.com.
WFC Valuation Summary
- In comparison to the median Financial Services stock, WFC's price/sales ratio is 17.39% lower, now standing at 1.9.
- WFC's price/sales ratio has moved down 1.7 over the prior 243 months.
Below are key valuation metrics over time for WFC.
Stock | Date | P/S | P/B | P/E | EV/EBIT |
---|---|---|---|---|---|
WFC | 2023-09-15 | 1.9 | 0.9 | 10.3 | 13.5 |
WFC | 2023-09-14 | 2.0 | 0.9 | 10.3 | 13.5 |
WFC | 2023-09-13 | 1.9 | 0.9 | 10.1 | 13.4 |
WFC | 2023-09-12 | 1.9 | 0.9 | 10.2 | 13.4 |
WFC | 2023-09-11 | 1.9 | 0.8 | 9.9 | 13.2 |
WFC | 2023-09-08 | 1.9 | 0.8 | 9.8 | 13.1 |
WFC Growth Metrics
- Its 4 year net cashflow from operations growth rate is now at 98.96%.
- The 2 year net income to common stockholders growth rate now stands at 55.48%.
- Its 2 year price growth rate is now at 67.78%.

The table below shows WFC's growth in key financial areas (numbers in millions of US dollars).
Date | Revenue | Operating Cash Flow | Net Income to Common Stock |
---|---|---|---|
2022-12-31 | 73,785 | 27,048 | 12,067 |
2022-09-30 | 74,981 | 24,620 | 14,952 |
2022-06-30 | 74,310 | 7,794 | 16,489 |
2022-03-31 | 77,552 | -7,856 | 19,393 |
2021-12-31 | 78,492 | -11,525 | 20,256 |
2021-09-30 | 89,400 | -39,107 | 17,535 |
WFC's Quality Factors
The “Quality” component of the POWR Ratings focuses on 31 different factors of a companies fundamentals and operational strength. Here are some key insights as we drill into the specifics of these quality attributes.- WFC has a Quality Grade of C, ranking ahead of 50.63% of graded US stocks.
- WFC's asset turnover comes in at 0.046 -- ranking 105th of 428 Banking stocks.
- UMPQ, PFSI, and UVSP are the stocks whose asset turnover ratios are most correlated with WFC.
The table below shows WFC's key quality metrics over time.
Period | Asset Turnover | Gross Margin | ROIC |
---|---|---|---|
2021-09-30 | 0.046 | 1 | 0.012 |
2021-06-30 | 0.046 | 1 | 0.010 |
2021-03-31 | 0.039 | 1 | 0.002 |
2020-12-31 | 0.037 | 1 | 0.000 |
2020-09-30 | 0.030 | 1 | 0.000 |
2020-06-30 | 0.032 | 1 | 0.002 |
WFC Price Target
For more insight on analysts targets of WFC, see our WFC price target page. And for a list of of all stocks sorted by upside potential based on analyst target price, see our Top Price Target page.
Average Price Target | $50.31 | Average Broker Recommendation | 1.65 (Moderate Buy) |
Wells Fargo & Company (WFC) Company Bio
Wells Fargo provides retail, commercial, and corporate banking services to individuals, businesses, and institutions. It has three operating segments: Community Banking, Wholesale Banking and Wealth, and Brokerage and Retirement. The company has branches across all 50 states and in 36 countries. The Company was founded in 1852 and is based in San Francisco, California.
Latest WFC News From Around the Web
Below are the latest news stories about WELLS FARGO & COMPANY that investors may wish to consider to help them evaluate WFC as an investment opportunity.
10 Best Investments During High Interest RatesIn this article, we discuss 10 best investments during high interest rates. If you want to skip our detailed discussion on the stock market outlook and industries benefiting the most due to high interest rates, head directly to 5 Best Investments During High Interest Rates. According to J.P. Morgan’s analysis last year, as mentioned by […] |
Housing Market 2023: 8 Cities That Will Give You $10K Toward Your Down PaymentWells Fargo Home Lending is offering $10,000 Homebuyer Access grants that will be applied toward the down payment for eligible homebuyers who currently live in or are purchasing homes in eight... |
A financial upheaval shakes up Bay Area banking’s major players: Where does Wells Fargo fall?Bay Area banking has long been dominated by two banks founded here, Bank of America and Wells Fargo. Chase (NYSE: JPM) has come a long way rather quickly in building its California branch network since entering the state in 2008, when it purchased Washington Mutual, the nation’s largest bank failure ever. First Republic ranked at No. 3 and Chase was No. 4 in 2022. |
TD Bank remains Philadelphia region's largest retail bank as Wells Fargo shrinks gapTD is still the largest local deposit taker in the Philadelphia region. After being dethroned from the top spot, Wells Fargo is again knocking on the door. |
Goldman (GS), Other Banks to Face Bond Collusion ClaimsGoldman (GS) and other banks are likely to face class-action lawsuits for colluding to drive up interest rates paid on a popular municipal bond. |
WFC Price Returns
1-mo | 0.00% |
3-mo | 2.37% |
6-mo | 12.63% |
1-year | 4.96% |
3-year | 88.35% |
5-year | -12.06% |
YTD | 2.07% |
2022 | -11.92% |
2021 | 61.15% |
2020 | -41.65% |
2019 | 21.44% |
2018 | -21.83% |
WFC Dividends
Ex-Dividend Date | Type | Payout Amount | Change | ||||||
---|---|---|---|---|---|---|---|---|---|
Loading, please wait... |
Continue Researching WFC
Here are a few links from around the web to help you further your research on Wells Fargo & Company's stock as an investment opportunity:Wells Fargo & Company (WFC) Stock Price | Nasdaq
Wells Fargo & Company (WFC) Stock Quote, History and News - Yahoo Finance
Wells Fargo & Company (WFC) Stock Price and Basic Information | MarketWatch
Loading social stream, please wait...