Winnebago Industries, Inc. (WGO): Price and Financial Metrics
GET POWR RATINGS... FREE!
WGO POWR Grades
- WGO scores best on the Value dimension, with a Value rank ahead of 91.4% of US stocks.
- WGO's strongest trending metric is Quality; it's been moving down over the last 179 days.
- WGO ranks lowest in Stability; there it ranks in the 19th percentile.
WGO Stock Summary
- WGO's went public 36.27 years ago, making it older than 92.84% of listed US stocks we're tracking.
- With a price/earnings ratio of 5.32, Winnebago Industries Inc P/E ratio is greater than that of about only 7.37% of stocks in our set with positive earnings.
- WGO's price/sales ratio is 0.43; that's higher than the P/S ratio of merely 9.3% of US stocks.
- Stocks that are quantitatively similar to WGO, based on their financial statements, market capitalization, and price volatility, are PATK, KMT, REGI, IMXI, and CRS.
- WGO's SEC filings can be seen here. And to visit Winnebago Industries Inc's official web site, go to www.winnebagoind.com.
WGO Valuation Summary
- WGO's price/sales ratio is 0.7; this is 50% lower than that of the median Consumer Cyclical stock.
- Over the past 243 months, WGO's price/sales ratio has gone down 0.2.
Below are key valuation metrics over time for WGO.
Stock | Date | P/S | P/B | P/E | EV/EBIT |
---|---|---|---|---|---|
WGO | 2021-08-27 | 0.7 | 2.4 | 10.2 | 7.3 |
WGO | 2021-08-26 | 0.7 | 2.4 | 10.1 | 7.2 |
WGO | 2021-08-25 | 0.7 | 2.5 | 10.3 | 7.4 |
WGO | 2021-08-24 | 0.7 | 2.4 | 10.2 | 7.2 |
WGO | 2021-08-23 | 0.7 | 2.3 | 9.8 | 7.0 |
WGO | 2021-08-20 | 0.7 | 2.3 | 9.8 | 7.0 |
WGO Growth Metrics
- Its year over year revenue growth rate is now at 21.92%.
- The 4 year cash and equivalents growth rate now stands at 233.42%.
- Its 5 year net income to common stockholders growth rate is now at 141.61%.

The table below shows WGO's growth in key financial areas (numbers in millions of US dollars).
Date | Revenue | Operating Cash Flow | Net Income to Common Stock |
---|---|---|---|
2021-12-31 | 3,992.456 | 296.498 | 324.078 |
2021-09-30 | 3,629.847 | 237.279 | 281.871 |
2021-06-30 | 3,331.561 | 255.951 | 240.245 |
2021-03-31 | 2,773.282 | 218.192 | 156.597 |
2020-12-31 | 2,560.206 | 188.731 | 104.797 |
2020-09-30 | 2,355.533 | 270.434 | 61.442 |
WGO's Quality Factors
The “Quality” component of the POWR Ratings focuses on 31 different factors of a companies fundamentals and operational strength. Here are some key insights as we drill into the specifics of these quality attributes.- WGO has a Quality Grade of B, ranking ahead of 75.37% of graded US stocks.
- WGO's asset turnover comes in at 1.891 -- ranking 5th of 68 Automobiles and Trucks stocks.
- DAN, LEA, and VC are the stocks whose asset turnover ratios are most correlated with WGO.
The table below shows WGO's key quality metrics over time.
Period | Asset Turnover | Gross Margin | ROIC |
---|---|---|---|
2021-08-28 | 1.891 | 0.179 | 0.404 |
2021-05-29 | 1.818 | 0.176 | 0.365 |
2021-02-27 | 1.612 | 0.162 | 0.260 |
2020-11-28 | 1.552 | 0.145 | 0.189 |
2020-08-29 | 1.479 | 0.133 | 0.126 |
2020-05-30 | 1.491 | 0.127 | 0.109 |
WGO Price Target
For more insight on analysts targets of WGO, see our WGO price target page. And for a list of of all stocks sorted by upside potential based on analyst target price, see our Top Price Target page.
Average Price Target | $86.00 | Average Broker Recommendation | 1.5 (Moderate Buy) |
WGO Stock Price Chart Interactive Chart >
WGO Price/Volume Stats
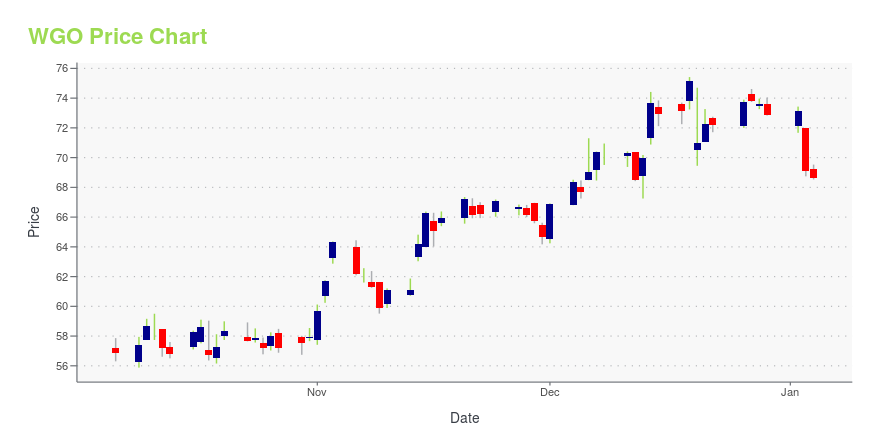
Current price | $45.31 | 52-week high | $80.30 |
Prev. close | $46.75 | 52-week low | $43.56 |
Day low | $43.56 | Volume | 1,467,700 |
Day high | $47.25 | Avg. volume | 788,995 |
50-day MA | $55.25 | Dividend yield | 1.54% |
200-day MA | $66.38 | Market Cap | 1.49B |
Winnebago Industries, Inc. (WGO) Company Bio
Winnebago Industries is a leading U.S. manufacturer of recreation vehicles, which are used primarily in leisure travel and outdoor recreation activities. The company was founded in 1958 and is based in Forest City, Iowa.
Latest WGO News From Around the Web
Below are the latest news stories about Winnebago Industries Inc that investors may wish to consider to help them evaluate WGO as an investment opportunity.
Winnebago Industries (WGO) Outpaces Stock Market Gains: What You Should KnowIn the latest trading session, Winnebago Industries (WGO) closed at $62, marking a +1.62% move from the previous day. |
7 Value Stocks to Buy in This Pricey MarketAs it turns out, fundamentals still matter. |
Those who invested in Winnebago Industries (NYSE:WGO) three years ago are up 135%Winnebago Industries, Inc. ( NYSE:WGO ) shareholders have seen the share price descend 11% over the month. But that... |
Winnebago Industries (WGO) Gains But Lags Market: What You Should KnowWinnebago Industries (WGO) closed the most recent trading day at $68.68, moving +0.38% from the previous trading session. |
Zacks Value Trader Highlights: BP, Asbury Automotive Group, MarineMax, Winnebago, Macy'sZacks Value Trader Highlights: BP, Asbury Automotive Group, MarineMax, Winnebago, Macy's. |
WGO Price Returns
1-mo | -19.28% |
3-mo | -28.25% |
6-mo | -36.88% |
1-year | -34.15% |
3-year | 39.24% |
5-year | 81.65% |
YTD | -39.18% |
2021 | 25.97% |
2020 | 14.19% |
2019 | 121.90% |
2018 | -56.04% |
2017 | 77.77% |
WGO Dividends
Ex-Dividend Date | Type | Payout Amount | Change | ||||||
---|---|---|---|---|---|---|---|---|---|
Loading, please wait... |
Continue Researching WGO
Here are a few links from around the web to help you further your research on Winnebago Industries Inc's stock as an investment opportunity:Winnebago Industries Inc (WGO) Stock Price | Nasdaq
Winnebago Industries Inc (WGO) Stock Quote, History and News - Yahoo Finance
Winnebago Industries Inc (WGO) Stock Price and Basic Information | MarketWatch
Loading social stream, please wait...