
Wyndham Hotels & Resorts, Inc. (WH): Price and Financial Metrics
WH Price/Volume Stats
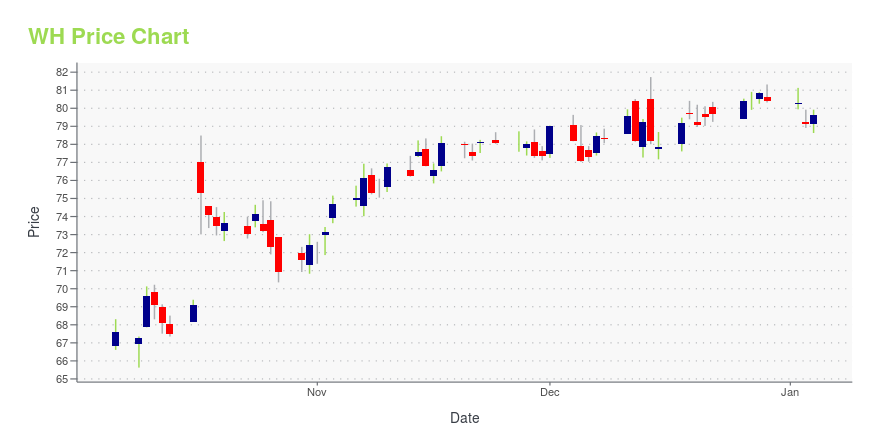
| Current price | $76.57 | 52-week high | $81.73 |
| Prev. close | $76.60 | 52-week low | $65.63 |
| Day low | $75.70 | Volume | 940,390 |
| Day high | $76.89 | Avg. volume | 766,301 |
| 50-day MA | $72.28 | Dividend yield | 2.05% |
| 200-day MA | $75.31 | Market Cap | 6.17B |
WH Stock Price Chart Interactive Chart >
Wyndham Hotels & Resorts, Inc. (WH) Company Bio
Wyndham Worldwide Corporation provides hospitality services and products to individual consumers and business customers worldwide under the Wyndham Hotels and Resorts, Ramada, Days Inn, Super 8, Howard Johnson, Wingate by Wyndham, Microtel Inns & Suites, Tryp by Wyndham, RCI, Landal GreenParks, Novasol, Hoseasons, cottages4you, James Villa Holidays, Wyndham Vacation Rentals, Wyndham Vacation Resorts, Shell Vacations Club, and WorldMark by Wyndham brand names. The company was founded in 2006 and is based in Parsippany, New Jersey.
Latest WH News From Around the Web
Below are the latest news stories about WYNDHAM HOTELS & RESORTS INC that investors may wish to consider to help them evaluate WH as an investment opportunity.
Choice Hotels Has Talked to Investors With 40% of Wyndham SharesWyndham didn't say it had returned to the deal talks with Choice Hotels last week, but Choice says it did. Choice is also wooing many of Wyndham's key investors. The saga is getting more intense. |
Wyndham Hotels & Resorts' Latest Release Shows How Divergent Their Board's Interests Are from Their Shareholders'; Their Arguments Seek to Undermine the Value-Creating Possibility of M&AChoice Hotels International, Inc. (NYSE: CHH) (the "Company" or "Choice"), today issued the following statement in response to the Wyndham Hotels & Resorts, Inc. (NYSE: WH) ("Wyndham") Board of Directors' recommendation that its shareholders reject Choice's exchange offer. |
Trademark Enters Malta with Boutique Hotel in Heart of St. Julian'sSeeking a boutique stay on Malta's vibrant east coast? Add the all-new Quadro Hotel, Trademark Collection by Wyndham, to your bucket list. |
Is It Too Late To Consider Buying Wyndham Hotels & Resorts, Inc. (NYSE:WH)?While Wyndham Hotels & Resorts, Inc. ( NYSE:WH ) might not be the most widely known stock at the moment, it saw a... |
Wyndham asks shareholders to reject Choice Hotels takeoverAfter repeated attempts to reach a deal, Choice Hotels International (CHH) launched an attempt at a hostile takeover of Wyndham Hotels & Resorts (WH) in an exchange offer with shareholders, valued at $8 billion. In response, on Monday morning Wyndham asked shareholders to reject the bid, claiming a low valuation and regulatory review of up to 24 months as reasons to reject. Yahoo Finance anchors Seana Smith and Brad Smith break down the latest development and what it means going forward. For more expert insight and the latest market action, click here to watch this full episode of Yahoo Finance Live. |
WH Price Returns
| 1-mo | 4.75% |
| 3-mo | 4.31% |
| 6-mo | -3.02% |
| 1-year | 3.06% |
| 3-year | 14.19% |
| 5-year | 46.44% |
| YTD | -3.81% |
| 2023 | 14.94% |
| 2022 | -19.06% |
| 2021 | 52.60% |
| 2020 | -4.15% |
| 2019 | 41.40% |
WH Dividends
| Ex-Dividend Date | Type | Payout Amount | Change | ||||||
|---|---|---|---|---|---|---|---|---|---|
| Loading, please wait... | |||||||||
Continue Researching WH
Want to do more research on Wyndham Hotels & Resorts Inc's stock and its price? Try the links below:Wyndham Hotels & Resorts Inc (WH) Stock Price | Nasdaq
Wyndham Hotels & Resorts Inc (WH) Stock Quote, History and News - Yahoo Finance
Wyndham Hotels & Resorts Inc (WH) Stock Price and Basic Information | MarketWatch
Loading social stream, please wait...