Westwood Holdings Group Inc (WHG): Price and Financial Metrics
WHG Price/Volume Stats
Current price | $9.95 | 52-week high | $14.20 |
Prev. close | $10.25 | 52-week low | $9.42 |
Day low | $9.95 | Volume | 12,644 |
Day high | $10.46 | Avg. volume | 11,339 |
50-day MA | $10.70 | Dividend yield | 5.95% |
200-day MA | $11.74 | Market Cap | 91.37M |
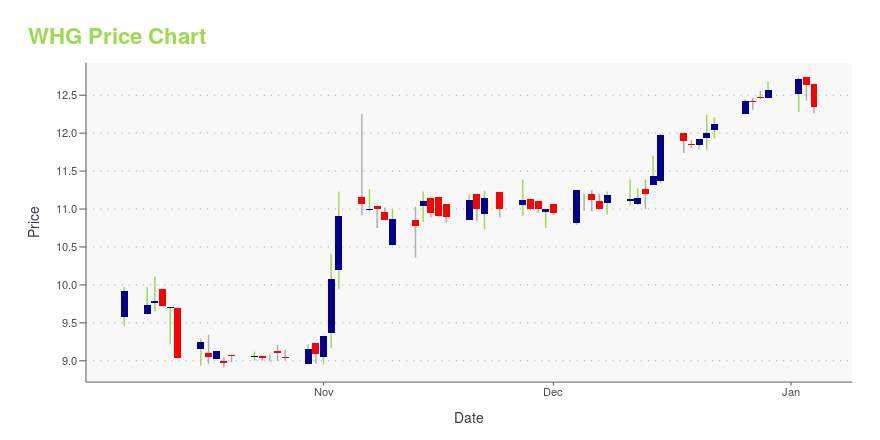
WHG Stock Price Chart Interactive Chart >
WHG POWR Grades
- WHG scores best on the Growth dimension, with a Growth rank ahead of 91.54% of US stocks.
- The strongest trend for WHG is in Growth, which has been heading up over the past 114 days.
- WHG's current lowest rank is in the Value metric (where it is better than 46.4% of US stocks).
WHG Stock Summary
- The price/operating cash flow metric for WESTWOOD HOLDINGS GROUP INC is higher than only 8.93% of stocks in our set with a positive cash flow.
- The ratio of debt to operating expenses for WESTWOOD HOLDINGS GROUP INC is higher than it is for about just 11.03% of US stocks.
- In terms of twelve month growth in earnings before interest and taxes, WESTWOOD HOLDINGS GROUP INC is reporting a growth rate of -94.71%; that's higher than just 14.83% of US stocks.
- Stocks with similar financial metrics, market capitalization, and price volatility to WESTWOOD HOLDINGS GROUP INC are PIK, NECB, FRGI, ZDGE, and OPHC.
- WHG's SEC filings can be seen here. And to visit WESTWOOD HOLDINGS GROUP INC's official web site, go to www.westwoodgroup.com.
WHG Valuation Summary
- WHG's EV/EBIT ratio is 269.5; this is 2284.96% higher than that of the median Financial Services stock.
- Over the past 243 months, WHG's price/earnings ratio has gone down 150.8.
Below are key valuation metrics over time for WHG.
Stock | Date | P/S | P/B | P/E | EV/EBIT |
---|---|---|---|---|---|
WHG | 2023-09-15 | 1.1 | 0.8 | -133.3 | 269.5 |
WHG | 2023-09-14 | 1.1 | 0.8 | -133.3 | 269.5 |
WHG | 2023-09-13 | 1.1 | 0.8 | -128.2 | 257.9 |
WHG | 2023-09-12 | 1.1 | 0.8 | -128.4 | 258.3 |
WHG | 2023-09-11 | 1.1 | 0.8 | -131.0 | 264.2 |
WHG | 2023-09-08 | 1.1 | 0.8 | -133.5 | 269.9 |
WHG Growth Metrics
- The year over year cash and equivalents growth rate now stands at 62.81%.
- Its 3 year net income to common stockholders growth rate is now at -70.2%.
- Its 4 year price growth rate is now at -55.46%.

The table below shows WHG's growth in key financial areas (numbers in millions of US dollars).
Date | Revenue | Operating Cash Flow | Net Income to Common Stock |
---|---|---|---|
2022-09-30 | 67.616 | 13.644 | 1.31 |
2022-06-30 | 70.07 | 32.756 | 4.364 |
2022-03-31 | 71.951 | 35.2 | 5.712 |
2021-12-31 | 73.054 | 19.385 | 9.763 |
2021-09-30 | 70.776 | 18.372 | 9.765 |
2021-06-30 | 68.37 | -32.824 | -2.403 |
WHG's Quality Factors
The “Quality” component of the POWR Ratings focuses on 31 different factors of a companies fundamentals and operational strength. Here are some key insights as we drill into the specifics of these quality attributes.- WHG has a Quality Grade of B, ranking ahead of 86.19% of graded US stocks.
- WHG's asset turnover comes in at 0.483 -- ranking 45th of 442 Trading stocks.
- COR, AMH, and SAMG are the stocks whose asset turnover ratios are most correlated with WHG.
The table below shows WHG's key quality metrics over time.
Period | Asset Turnover | Gross Margin | ROIC |
---|---|---|---|
2021-09-30 | 0.483 | 1 | 0.137 |
2021-06-30 | 0.459 | 1 | 0.026 |
2021-03-31 | 0.452 | 1 | -0.006 |
2020-12-31 | 0.435 | 1 | -0.089 |
2020-09-30 | 0.424 | 1 | -0.080 |
2020-06-30 | 0.430 | 1 | 0.046 |
Westwood Holdings Group Inc (WHG) Company Bio
Westwood Holdings provides investment management services to institutional investors, private wealth clients and financial intermediaries. The company was founded in 1983 and is based in Dallas, Texas.
Latest WHG News From Around the Web
Below are the latest news stories about WESTWOOD HOLDINGS GROUP INC that investors may wish to consider to help them evaluate WHG as an investment opportunity.
Insider Sell: COO John Montgomery Sells 1,667 Shares of Westwood Holdings Group IncOn September 11, 2023, John Montgomery, the Chief Operating Officer (COO) of Westwood Holdings Group Inc (NYSE:WHG), sold 1,667 shares of the company. |
Westwood Holdings Group (NYSE:WHG) Has Announced A Dividend Of $0.15Westwood Holdings Group, Inc.'s ( NYSE:WHG ) investors are due to receive a payment of $0.15 per share on 2nd of... |
Don't Buy Westwood Holdings Group, Inc. (NYSE:WHG) For Its Next Dividend Without Doing These ChecksWestwood Holdings Group, Inc. ( NYSE:WHG ) is about to trade ex-dividend in the next 4 days. The ex-dividend date is... |
Wells Fargo offers down-payment grants to boost minority homeownershipThe company is rolling out a special-purpose credit program to help address what it describes as "the biggest barriers to achieving homeownership." Such programs are gaining popularity among banks. |
Is Wells Fargo Stock a Buy?The bank's past keeps coming back to haunt it. Ignore all the noise and focus on the long-term future. |
WHG Price Returns
1-mo | -0.52% |
3-mo | -19.22% |
6-mo | -8.84% |
1-year | 2.80% |
3-year | 5.86% |
5-year | -73.16% |
YTD | -7.09% |
2022 | -31.43% |
2021 | 32.00% |
2020 | -50.15% |
2019 | -4.41% |
2018 | -45.76% |
WHG Dividends
Ex-Dividend Date | Type | Payout Amount | Change | ||||||
---|---|---|---|---|---|---|---|---|---|
Loading, please wait... |
Continue Researching WHG
Want to see what other sources are saying about Westwood Holdings Group Inc's financials and stock price? Try the links below:Westwood Holdings Group Inc (WHG) Stock Price | Nasdaq
Westwood Holdings Group Inc (WHG) Stock Quote, History and News - Yahoo Finance
Westwood Holdings Group Inc (WHG) Stock Price and Basic Information | MarketWatch
Loading social stream, please wait...