
WalkMe Ltd. (WKME): Price and Financial Metrics
WKME Price/Volume Stats
| Current price | $13.87 | 52-week high | $14.09 |
| Prev. close | $13.85 | 52-week low | $7.60 |
| Day low | $13.85 | Volume | 583,855 |
| Day high | $13.91 | Avg. volume | 407,530 |
| 50-day MA | $12.45 | Dividend yield | N/A |
| 200-day MA | $10.07 | Market Cap | 1.20B |
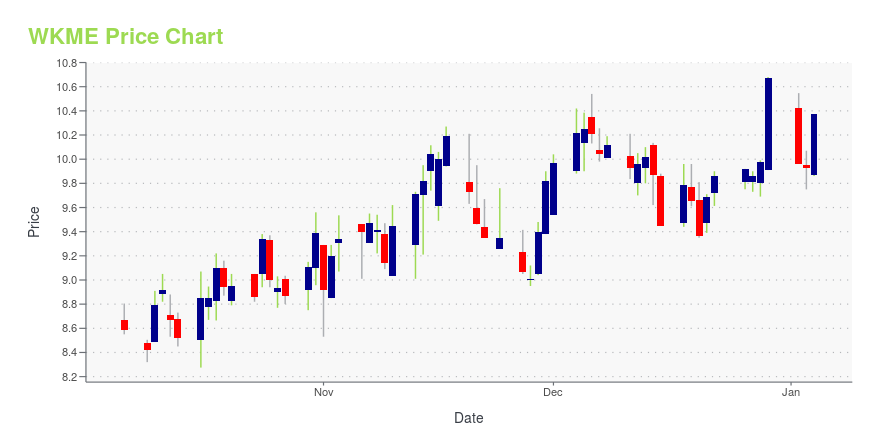
WKME Stock Price Chart Interactive Chart >
WalkMe Ltd. (WKME) Company Bio
WalkMe Ltd. provides cloud-based digital adoption platform in the United States and internationally. Its digital adoption platform enables organizations to measure, drive, and act to maximize the impact of their digital transformation and accelerate the return on their software investment. The company was formerly known as Make Tutorial Ltd. and changed its name to WalkMe Ltd. in March 2012. WalkMe Ltd. was incorporated in 2011 and is headquartered in Tel Aviv-Yafo, Israel.
Latest WKME News From Around the Web
Below are the latest news stories about WALKME LTD that investors may wish to consider to help them evaluate WKME as an investment opportunity.
WalkMe Survey Shows Half of Workers Don’t File Expense Reports, Leaving Billions of Dollars on the TableUnreimbursed expenses creates job stress (48%) and financial tension during the holidays (28%); U.S. workers leave $2 billion behind annuallySAN FRANCISCO, Dec. 20, 2023 (GLOBE NEWSWIRE) -- WalkMe Inc. (NASDAQ: WKME), a leading provider of digital adoption solutions, today announced new survey results that show half of workers (49.7%) around the world are not filing an expense report for money due back to them, leaving billions of dollars on the table. With employees leaving an average of $26.25 |
While individual investors own 18% of WalkMe Ltd. (NASDAQ:WKME), private equity firms are its largest shareholders with 64% ownershipKey Insights Significant control over WalkMe by private equity firms implies that the general public has more power to... |
Wall Street Analysts Think WalkMe (WKME) Could Surge 42.87%: Read This Before Placing a BetThe consensus price target hints at a 42.9% upside potential for WalkMe (WKME). While empirical research shows that this sought-after metric is hardly effective, an upward trend in earnings estimate revisions could mean that the stock will witness an upside in the near term. |
WalkMe (WKME) Upgraded to Buy: Here's WhyWalkMe (WKME) has been upgraded to a Zacks Rank #2 (Buy), reflecting growing optimism about the company's earnings prospects. This might drive the stock higher in the near term. |
WalkMe Enhances Customer Access with Availability on AWS MarketplaceMarket-leading Digital Adoption Platform (DAP) now available on AWS Marketplace;Gives customers more options to transact and flexibility to invest in DAP SAN FRANCISCO, Nov. 29, 2023 (GLOBE NEWSWIRE) -- WalkMe Inc. (NASDAQ: WKME), a leading provider of digital adoption solutions, today announced the availability of the WalkMe Digital Adoption Platform (DAP) on the AWS Marketplace, further extending its market reach to provide customers with enhanced accessibility to its powerful digital adoption |
WKME Price Returns
| 1-mo | -0.79% |
| 3-mo | 74.91% |
| 6-mo | 29.99% |
| 1-year | 57.61% |
| 3-year | -51.62% |
| 5-year | N/A |
| YTD | 29.99% |
| 2023 | -4.56% |
| 2022 | -43.05% |
| 2021 | N/A |
| 2020 | N/A |
| 2019 | N/A |
Loading social stream, please wait...