West Pharmaceutical Services Inc. (WST): Price and Financial Metrics

West Pharmaceutical Services Inc. (WST): $395.72

8.10 (+2.09%)

POWR Rating

Component Grades

Momentum

F

Stability

C

Sentiment

Quality

B

WST Price/Volume Stats

Current price $395.72 52-week high $415.73
Prev. close $387.62 52-week low $310.42
Day low $388.40 Volume 522,700
Day high $396.34 Avg. volume 583,328
50-day MA $367.83 Dividend yield 0.2%
200-day MA $368.11 Market Cap 28.97B

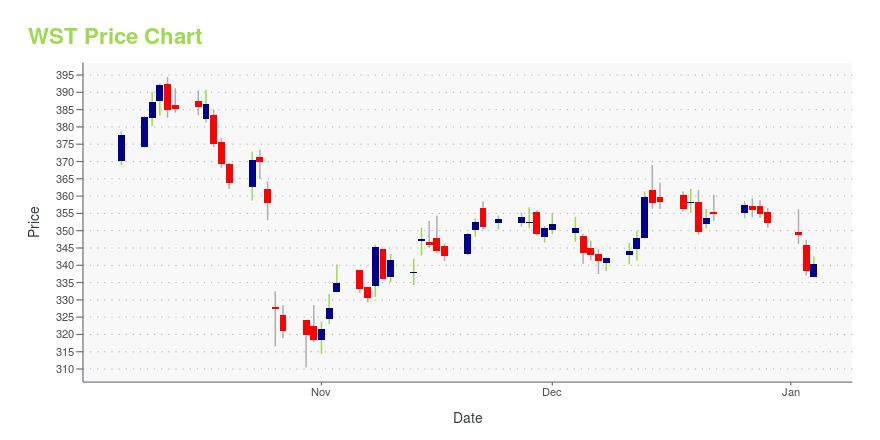
WST Stock Price Chart Interactive Chart >

WST POWR Grades

  • Sentiment is the dimension where WST ranks best; there it ranks ahead of 92.43% of US stocks.
  • The strongest trend for WST is in Growth, which has been heading up over the past 26 weeks.
  • WST's current lowest rank is in the Momentum metric (where it is better than 7.41% of US stocks).

WST Stock Summary

  • With a market capitalization of $25,028,485,671, WEST PHARMACEUTICAL SERVICES INC has a greater market value than 90.74% of US stocks.
  • WEST PHARMACEUTICAL SERVICES INC's stock had its IPO on January 5, 1988, making it an older stock than 89.57% of US equities in our set.
  • In terms of volatility of its share price, WST is more volatile than merely 8.61% of stocks we're observing.
  • Stocks with similar financial metrics, market capitalization, and price volatility to WEST PHARMACEUTICAL SERVICES INC are GMED, ALGN, WAB, GNRC, and CSGP.
  • WST's SEC filings can be seen here. And to visit WEST PHARMACEUTICAL SERVICES INC's official web site, go to www.westpharma.com.

WST Valuation Summary

  • WST's EV/EBIT ratio is 37.1; this is 154.11% higher than that of the median Healthcare stock.
  • WST's price/earnings ratio has moved up 19.7 over the prior 243 months.

Below are key valuation metrics over time for WST.

Stock Date P/S P/B P/E EV/EBIT
WST 2023-12-29 8.9 9.1 46.6 37.1
WST 2023-12-28 9.0 9.2 46.9 37.4
WST 2023-12-27 9.0 9.2 47.1 37.5
WST 2023-12-26 9.0 9.2 47.3 37.7
WST 2023-12-22 9.0 9.2 46.9 37.4
WST 2023-12-21 8.9 9.1 46.8 37.3

WST Growth Metrics

    The 5 year net income to common stockholders growth rate now stands at 42.95%.
  • The 5 year cash and equivalents growth rate now stands at 97.93%.
  • Its 5 year net cashflow from operations growth rate is now at 58.88%.
Over the past 70 months, WST's revenue has gone up $1,352,200,000.

The table below shows WST's growth in key financial areas (numbers in millions of US dollars).

Date Revenue Operating Cash Flow Net Income to Common Stock
2022-12-31 2,886.9 724 585.9
2022-09-30 2,909 654 630.6
2022-06-30 2,928.6 675.2 685.6
2022-03-31 2,880.9 646.5 684.4
2021-12-31 2,831.6 584 661.8
2021-09-30 2,681 571.9 612.5

WST's Quality Factors

The “Quality” component of the POWR Ratings focuses on 31 different factors of a companies fundamentals and operational strength. Here are some key insights as we drill into the specifics of these quality attributes.
  • WST has a Quality Grade of B, ranking ahead of 77.04% of graded US stocks.
  • WST's asset turnover comes in at 0.924 -- ranking 9th of 22 Rubber and Plastic Products stocks.
  • TUP, MYE, and ENTG are the stocks whose asset turnover ratios are most correlated with WST.

The table below shows WST's key quality metrics over time.

Period Asset Turnover Gross Margin ROIC
2021-09-30 0.924 0.405 0.359
2021-06-30 0.913 0.394 0.328
2021-03-31 0.885 0.375 0.281
2020-12-31 0.857 0.358 0.238
2020-09-30 0.852 0.348 0.220
2020-06-30 0.850 0.341 0.206

WST Price Target

For more insight on analysts targets of WST, see our WST price target page. And for a list of of all stocks sorted by upside potential based on analyst target price, see our Top Price Target page.

Average Price Target $436.00 Average Broker Recommendation 1.5 (Moderate Buy)

West Pharmaceutical Services Inc. (WST) Company Bio


West Pharmaceutical Services, Inc. is a designer and manufacturer of injectable pharmaceutical packaging and delivery systems. Founded in 1923 by Herman O. West and J.R. Wike of Philadelphia, the company is headquartered in Exton, Pennsylvania. In its early years of development, West produced rubber components for packaging injectable drugs, providing a sterile environment for the producers of penicillin and insulin. (Source:Wikipedia)


WST Latest News Stream


Event/Time News Detail
Loading, please wait...

WST Latest Social Stream


Loading social stream, please wait...

View Full WST Social Stream

Latest WST News From Around the Web

Below are the latest news stories about WEST PHARMACEUTICAL SERVICES INC that investors may wish to consider to help them evaluate WST as an investment opportunity.

MMSI or WST: Which Is the Better Value Stock Right Now?

MMSI vs. WST: Which Stock Is the Better Value Option?

Yahoo | December 28, 2023

West Announces First-Quarter 2024 Dividend

West Pharmaceutical Services, Inc. (NYSE: WST), a global leader in innovative solutions for injectable drug administration, announced today that the Company's Board of Directors has approved a first-quarter 2024 dividend of $0.20 per share. The dividend will be paid on February 7, 2024, to shareholders of record as of January 31, 2024.

Yahoo | December 6, 2023

West Pharmaceutical's (WST) New Launch to Expand Portfolio

West Pharmaceutical's (WST) latest addition to its portfolio is likely to address the critical need for more drug preparation and delivery options at the point of care.

Yahoo | December 5, 2023

West Receives FDA 510(k) Clearance for Vial2Bag Advanced® 13mm Admixture Device

West Pharmaceutical Services, Inc. (NYSE: WST), a global leader in innovative solutions for injectable drug administration systems, today announced FDA 510(k) clearance and launch of its Vial2Bag Advanced® 13mm admixture device.

Yahoo | December 4, 2023

Reasons to Retain West Pharmaceutical (WST) in Your Portfolio

West Pharmaceutical (WST) continues to gain momentum due to its strength in the Proprietary Products business. However, forex concerns persist.

Yahoo | November 29, 2023

Read More 'WST' Stories Here

WST Price Returns

1-mo 9.30%
3-mo 10.50%
6-mo 3.08%
1-year 20.28%
3-year 43.75%
5-year 281.89%
YTD 12.44%
2023 49.97%
2022 -49.70%
2021 65.88%
2020 89.05%
2019 54.13%

WST Dividends

Ex-Dividend Date Type Payout Amount Change
Loading, please wait...
View Full WST Dividend History

Get Free Updates

Join thousands of investors who get the latest news, insights and top rated picks from StockNews.com!